Priority List
-
Determination of validity of existing data
-
Peer revue of code
-
I've forgotten most of what I did, so I can plausibly be considered one
peer; another would be nice.
-
At the very least, flag questionable points in the code and nag Stefan
about them.
-
Segmentation of results?
-
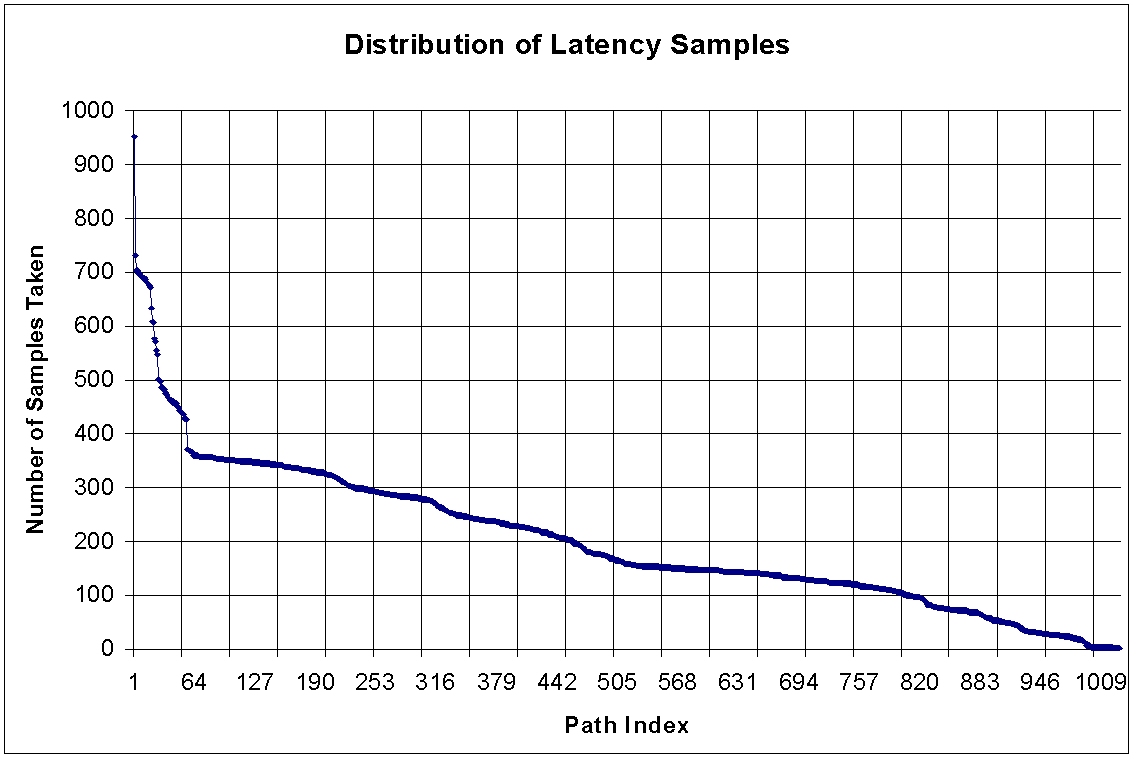
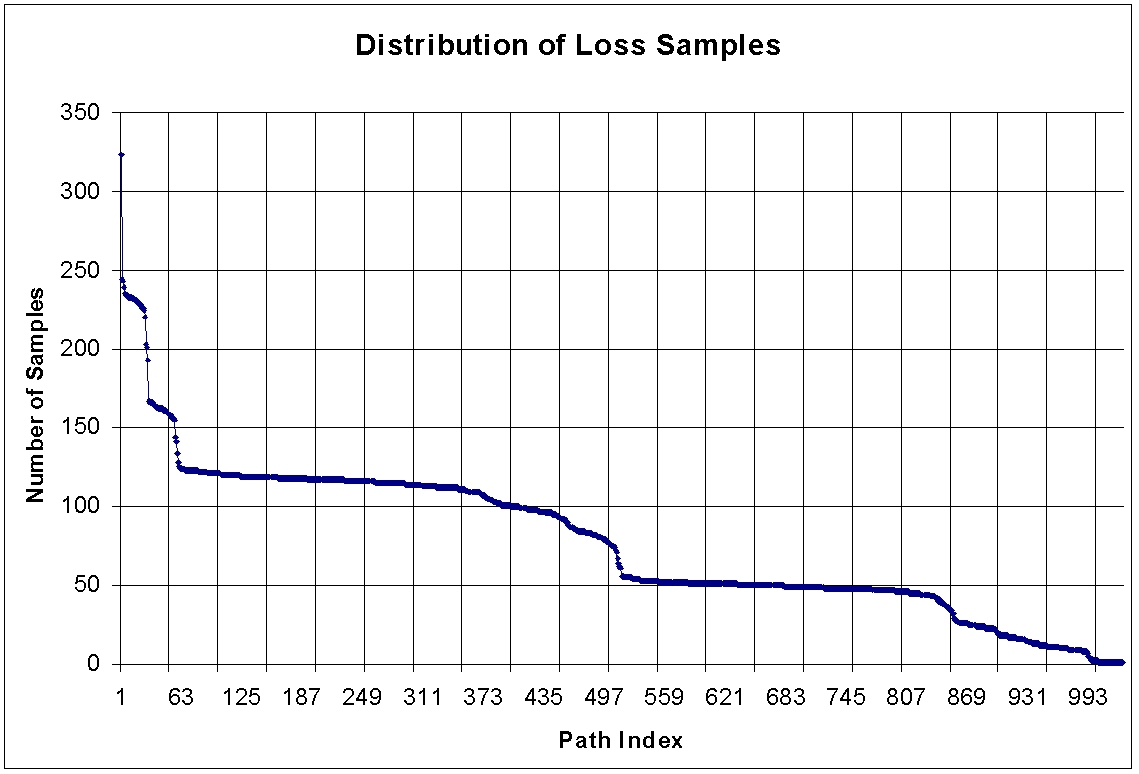
The sampling graph shows distinct sampling strata, especially for the much
maligned loss data.
-
This might be due to how I'm extracting loss data; see peer
revue
-
We might want to use only those that have high sampling rates; the upper
stratum.
-
Statistical tests on the data? I read about those somewhere...
-
Time to call 411
-
See graphs; Stefan's point about questioning the
validity of the data via examination of graphs seems valid. Specifically,
-
The sampling graphs {latency,
drops}
-
My thought is that the xmas-tree demonstrated in the loss graph, and to
some extent the latency graph is the source of the tree in the correlation
and general loss graphs.
-
Why is it so stratified? There was probably a point in the study
where I entered a number of new points; thus, new paths came to be measured
in addition to the old.
-
It's unclear to me right now why that would cause the probability distribution
stratification, however.
-
Graphs, more of them.
-
Evil Nap
-
Graph the number of paths with better alternates that pass through known
congestion points. Corbató can give us a list of NAPs to test
against.
-
Search for common links/hops/AS's
-
for each hop, number of bad paths containing that hop
-
do again, but subtract hops that appear in good paths (idea is to only
consider hops that only appear in bad paths)
-
for each bad path, number of hops in common with other bad paths
-
do again, but use number of hops only held in common with other bad paths
(i.e.. don't appear in good paths)
-
Do this at the AS granularity (we can use the code from AS-Traceroute
to transform our traceroute measurements into AS-path measurements)
-
Multi-time scale analysis... is routing inefficiency the same across different
time scales? Very easy to test (10 minutes, 1 hour, 8 hours, 24 hours,
two days, one week, one month)
-
 Correlation
between drop rates and path length? (we'd expect so)
Correlation
between drop rates and path length? (we'd expect so)
-
Correlation
between drop rates and RTT? (we'd expect so)
-
More?
-
General [1]
-
Relative difference in latency between best path wrt hop count and best
path wrt latency
-
Absolute difference in latency between best path wrt hop count and best
path wrt latency
-
Relative difference in loss rate between best path wrt hop count and best
path wrt loss rate
-
Absolute difference in loss rate between best path wrt hop count and best
path wrt loss rate
-
Then do the same thing for best paths wrt AS-path length.
-
Search for bad hops
-
look for a big latency jump in traceroute
-
look for a big increase in drop rate in traceroute
-
top x worst hops that add up to difference between path and best better
path (idea is that these hops are contributing the added "badness")
-
for each bad hop, plot number of paths containing it
-
General - 2
-
Median equivalents of the current graphs?
-
I have the data on hand.
-
Empirically, the median curve is not that much different, but if it provides
us with a stronger case, then perhaps a good idea.
-
Translation of our two-way loss data into one-way loss data
-
( 1 - P( you get a response from the end host |
your initial UDP got through ) ) into one-way loss data
-
( 1 - P( your initial UDP got through ) or 1 - P( your response
packet, known to be sent, was received by you ) ).
-
Dammit John, why aren't you running SPF yet?
-
I'm lazy
-
Triangles are easier to reason about right now.
-
Ouruboros / The Second Coding of John
-
Pulling out my original code set/ideas for pseudo-instantaneous measurements,
and integrating it into the existing framework.
-
If we do instantaneous, it would seem as though we'd have to do
a simultaneous average cost study, to have comparable results.
-
Integration/coordination is required, to avoid overloading the slave servers.
-
And yet we have to segregate the result sets, to retain non correlation
claims about the concurrent cost average data set.
-
What is the time window we will declare as instantaneous?
-
Explication of the Ngon size determines window size, along with the number
of concurrently running traceroutes we'd allow on that server, server hit
rate distribution, etc.
-
Should we contact a few key points, and ask to be able to put heavier load
on them?
-
MIT, UTexas, etc..
-
Or would this necessarily unbalance the study? (probably).
-
What are the selection criteria for a given Ngon?
-
Purely random selection?
-
Dynamic analysis of the time average data, providing promising paths at
runtime
-
Analysis of the existing data set for "seed" Ngons.
-
More nodes [2]
-
PASTA, PESTO
-
Pareto Encapsulation of Statistical Testing Operations?
-
Fix the server bug, or rewrite the bloody thing; a bulky server is unnecessary.
-
What are the stability characteristics of the better indirect paths?
-
"Predictability of alternate routes"
-
Technical Report
-
Goals
-
MSA?
-
"One idea is to create a tool that uses the measurements to select/advertise
routes. We should have a straw proposal for how this would work (i.e.
what we can influence using exist precedence and path prepend) and at least
a back of the envelope idea of whether it would help (i.e., is this just
an automatic load balancing tool or can we really improve stuff with so
few degrees of freedom... here at UW we just get to select between verio
and MCI)"[1]