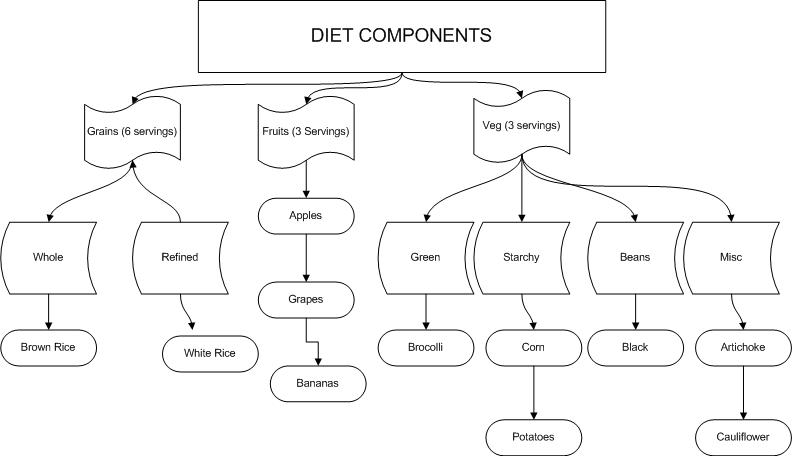
This data visualization shows the number of servings per food group a person eats in contrast with the recommended number of servings. The basic structure is based off of a standard tree view but the system adds the functionality of dynamic updating based on user input. My initial idea was to have a 3-D teeter-totter scale so show how "balanced" a diet was, but was too difficult to animate in k-sketch.
While this animation does a good job of demonstrating the functionality of the system, it does not sufficiently show the hierarchical nature of this data set, as drawing this in K-sketch would be ugly! Please view the the below image to get an idea of of the animation and the hierarchy could be combined to make a more detailed system.