 |
|
The following graphs have been generated at one point or another, archived here for the non-masses.
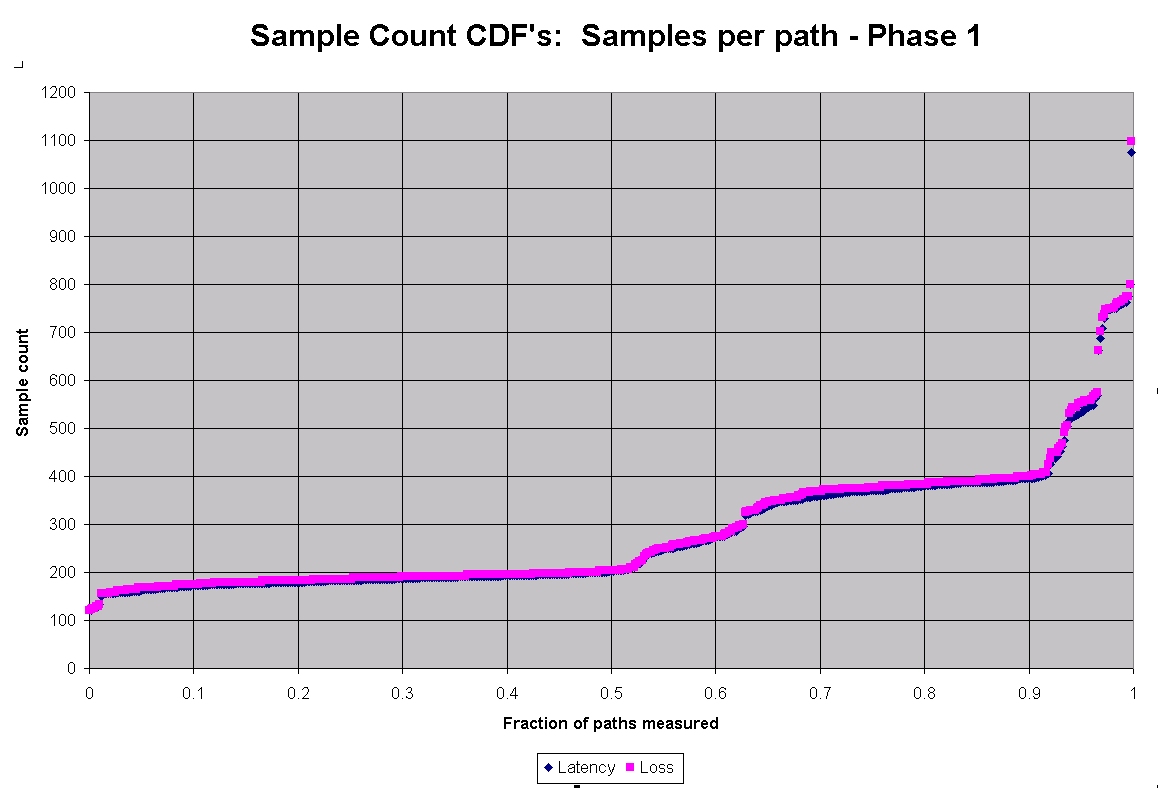
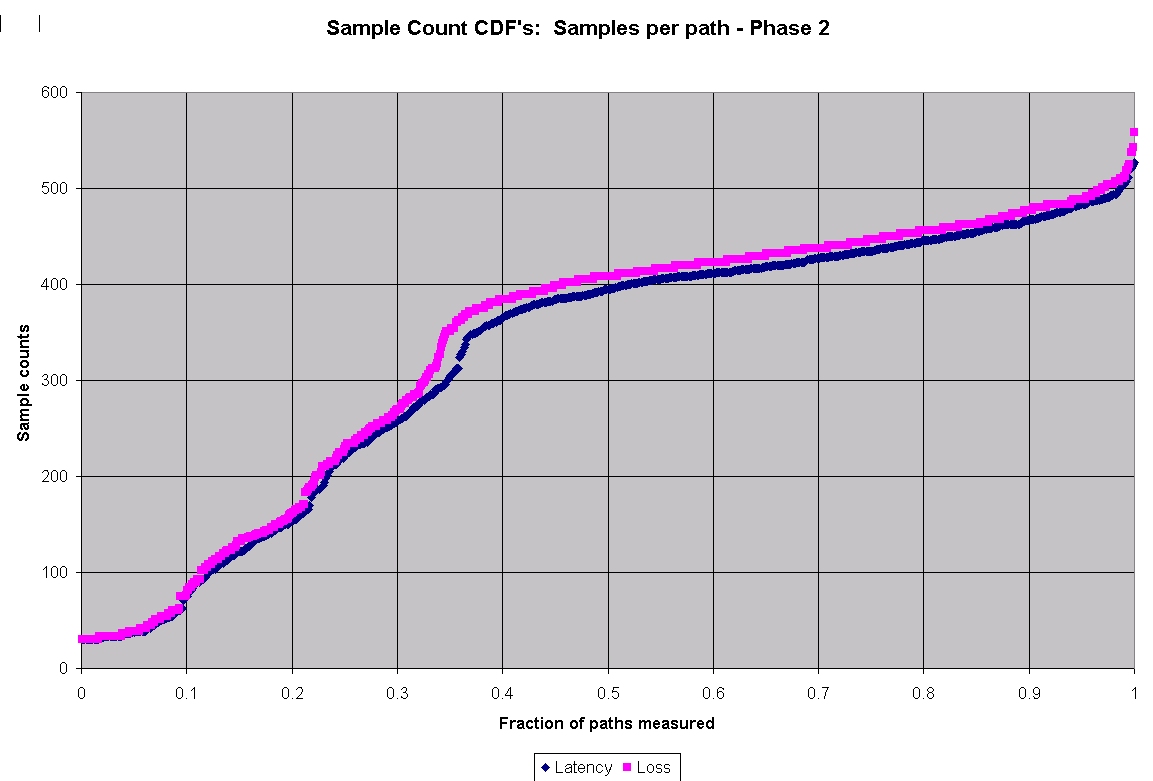
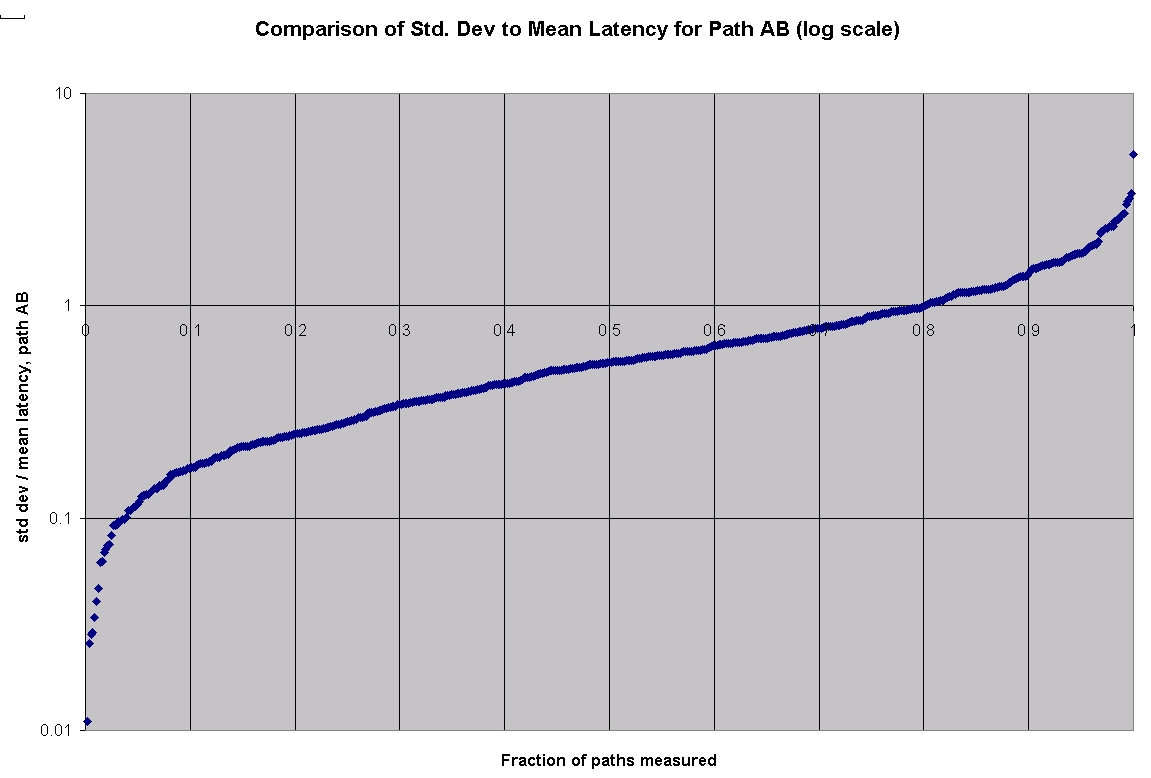
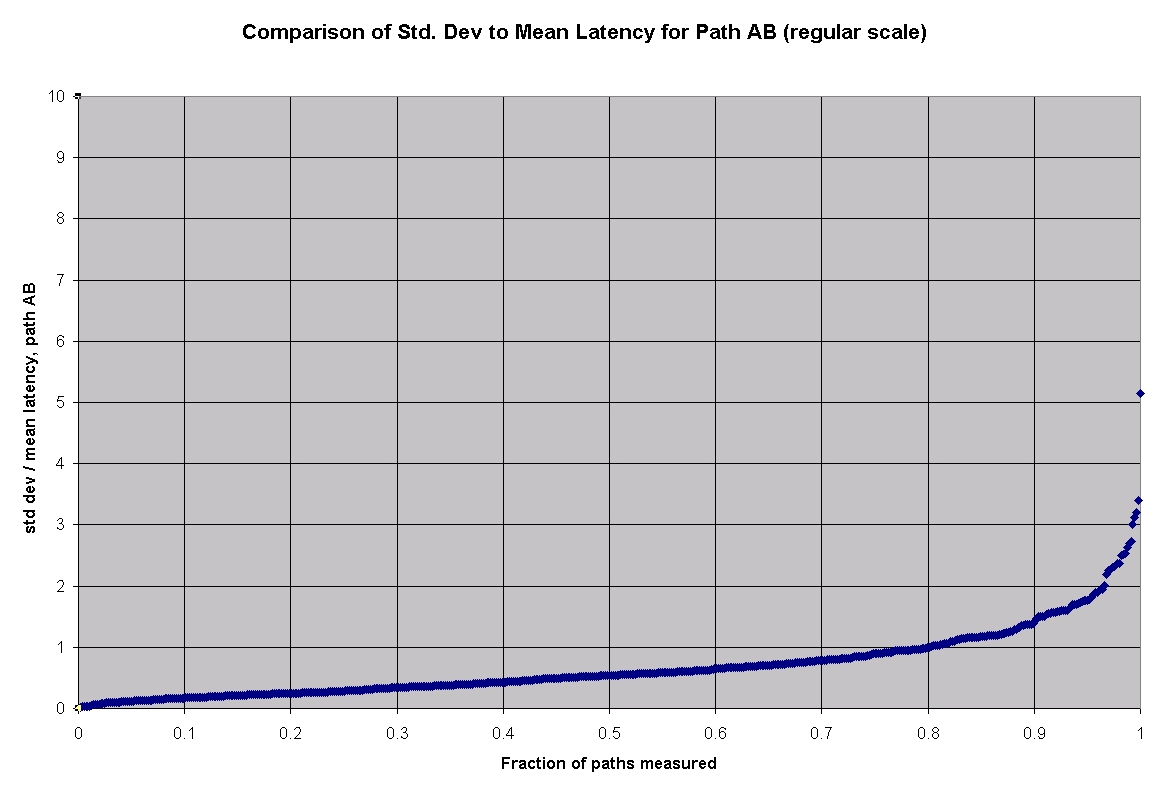
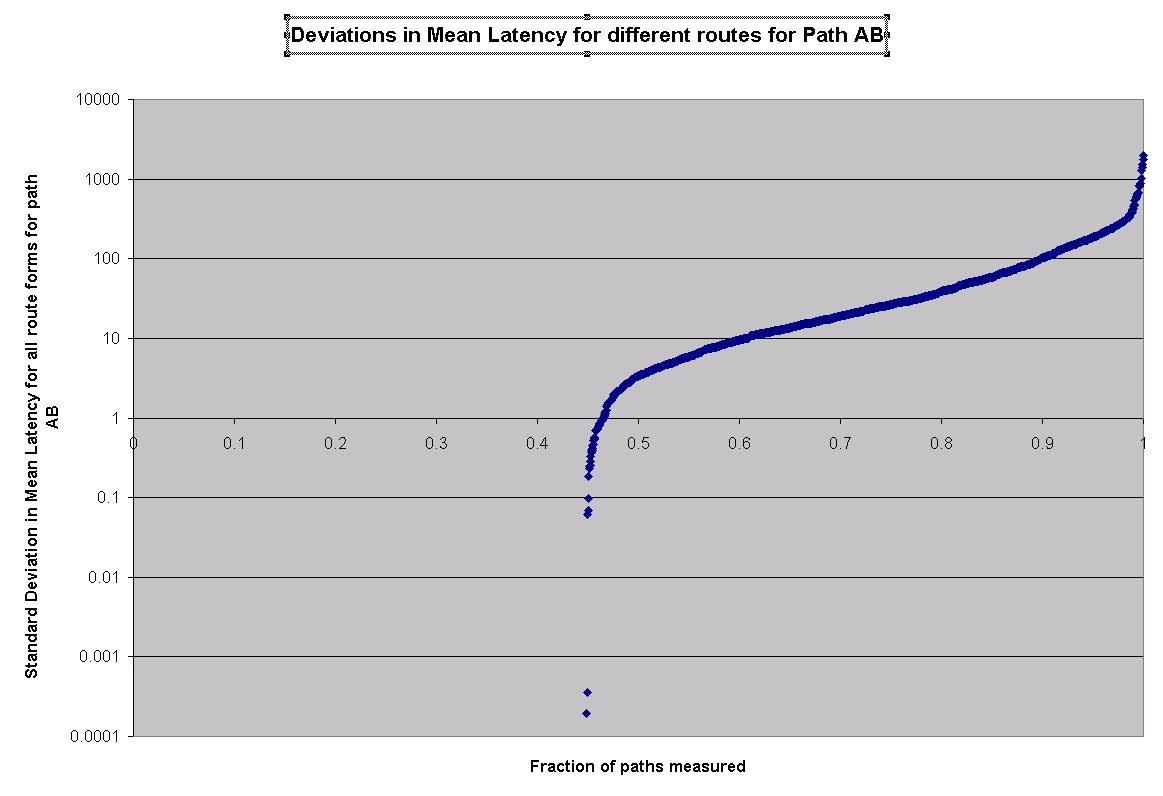
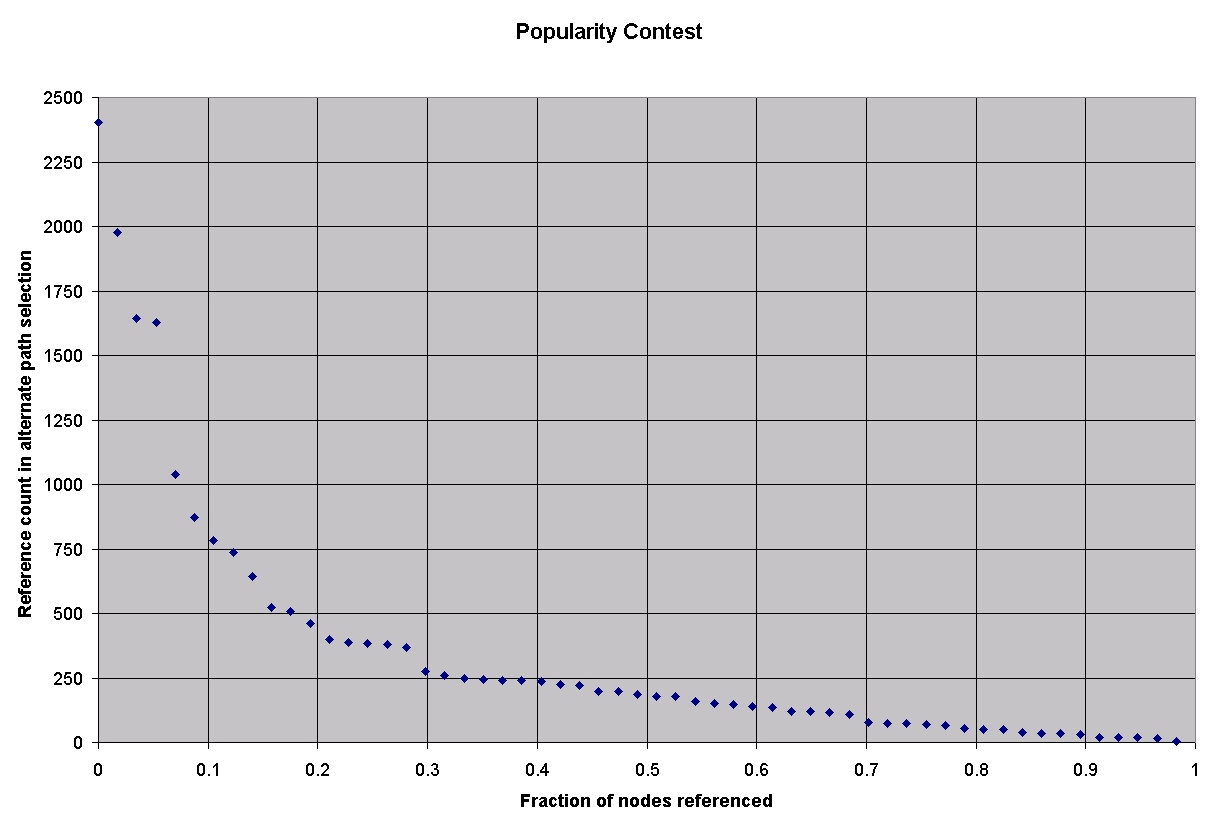
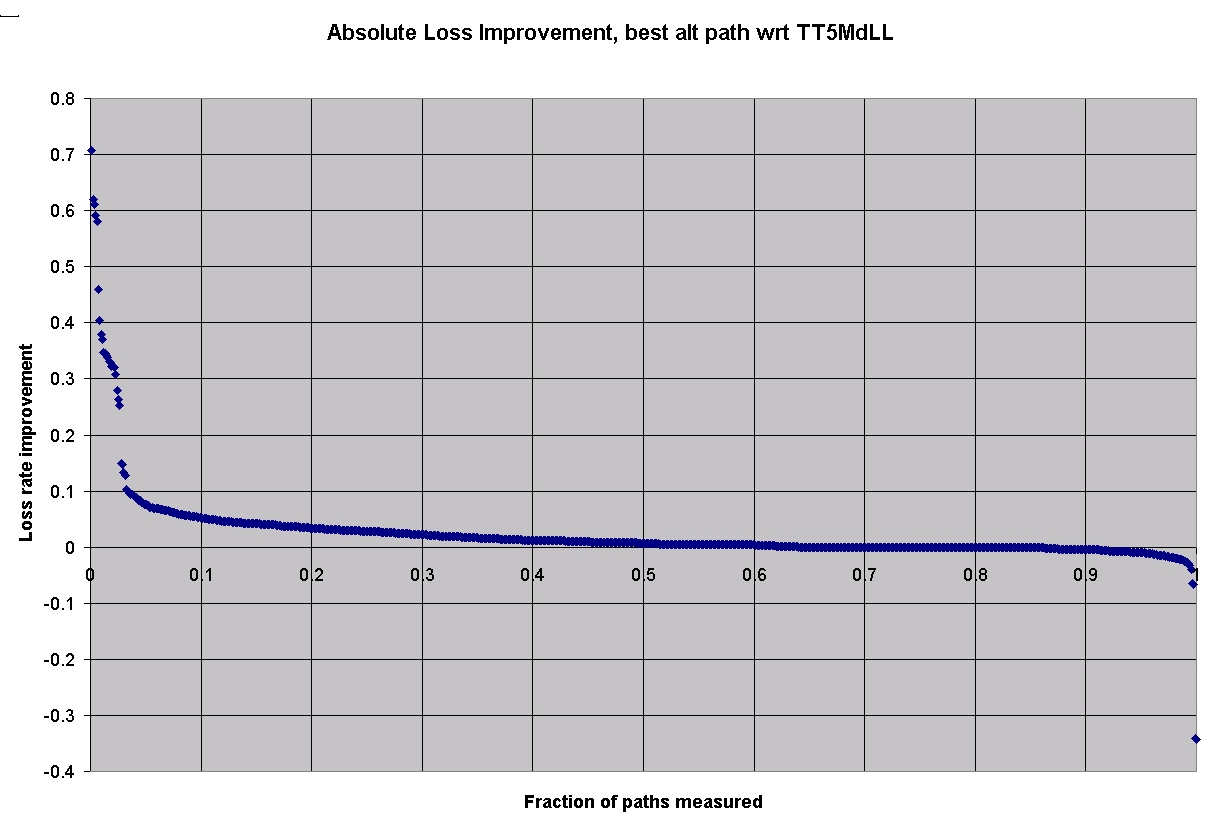
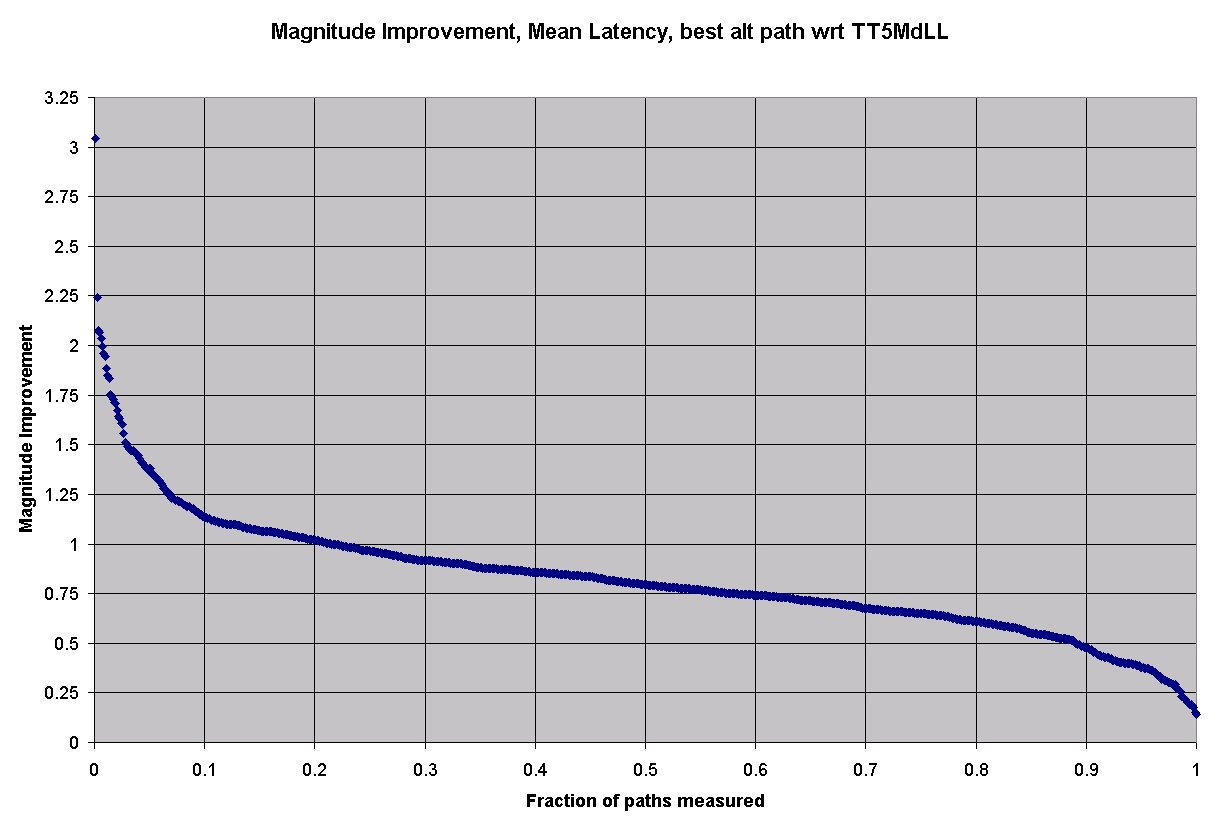
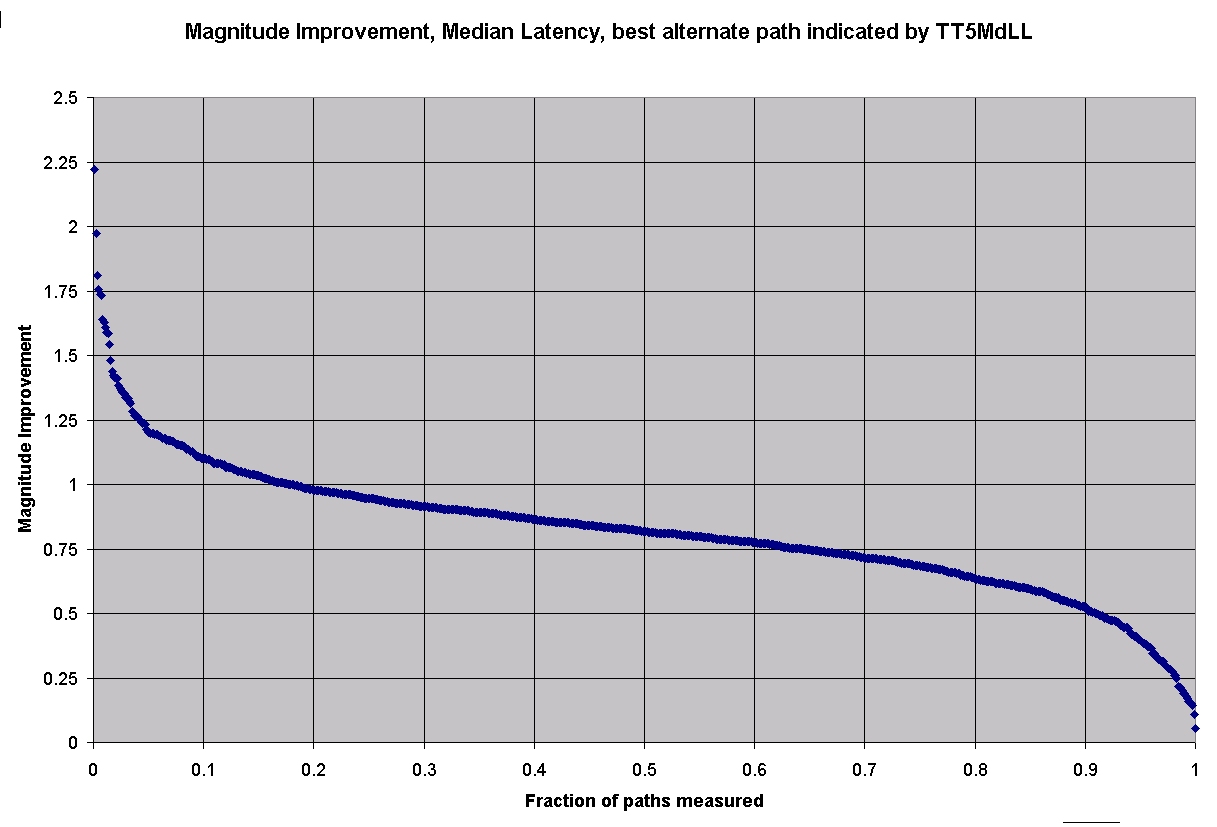
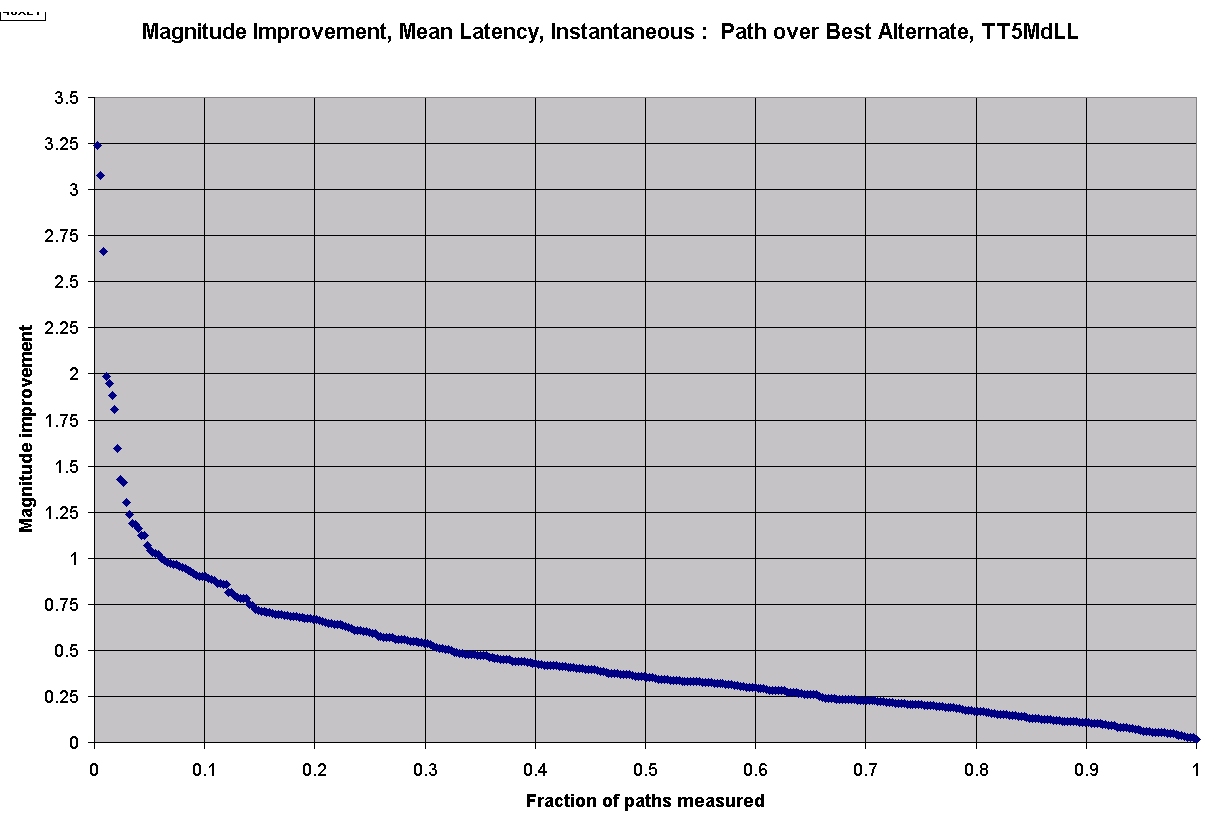
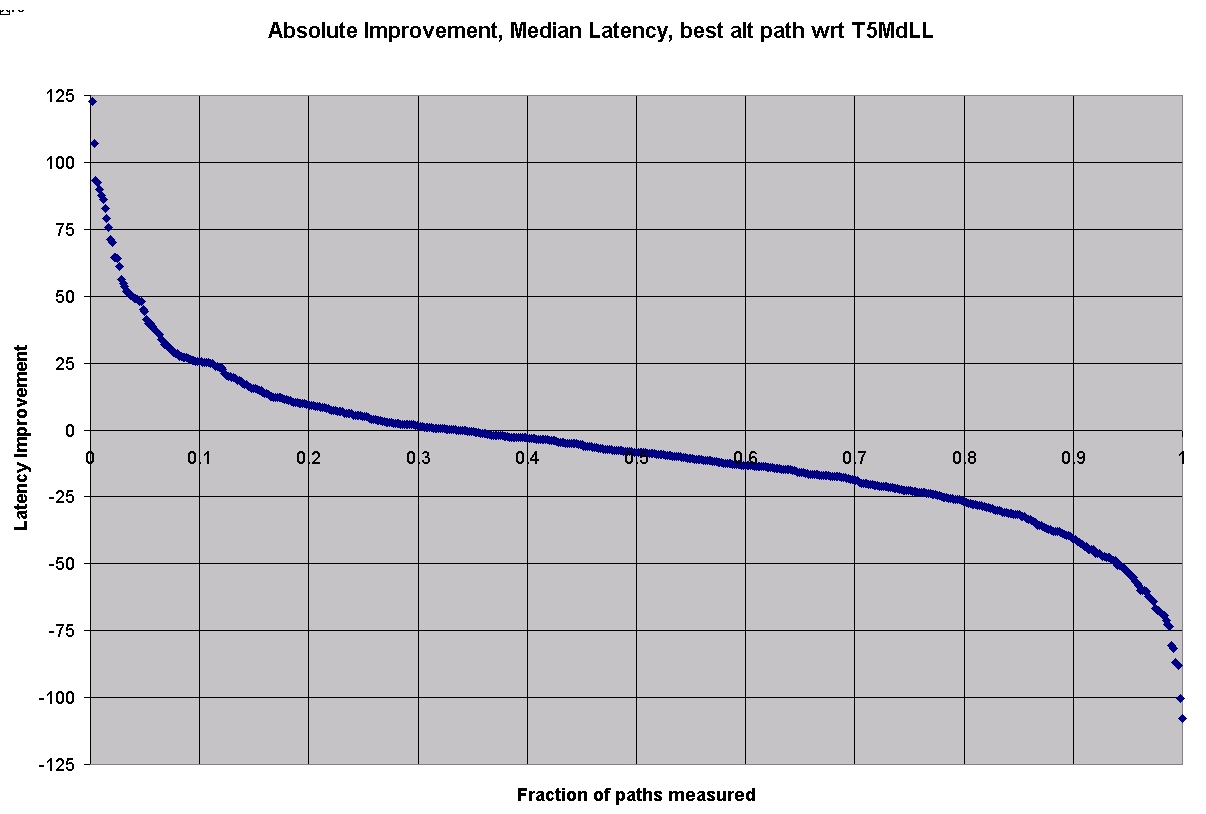
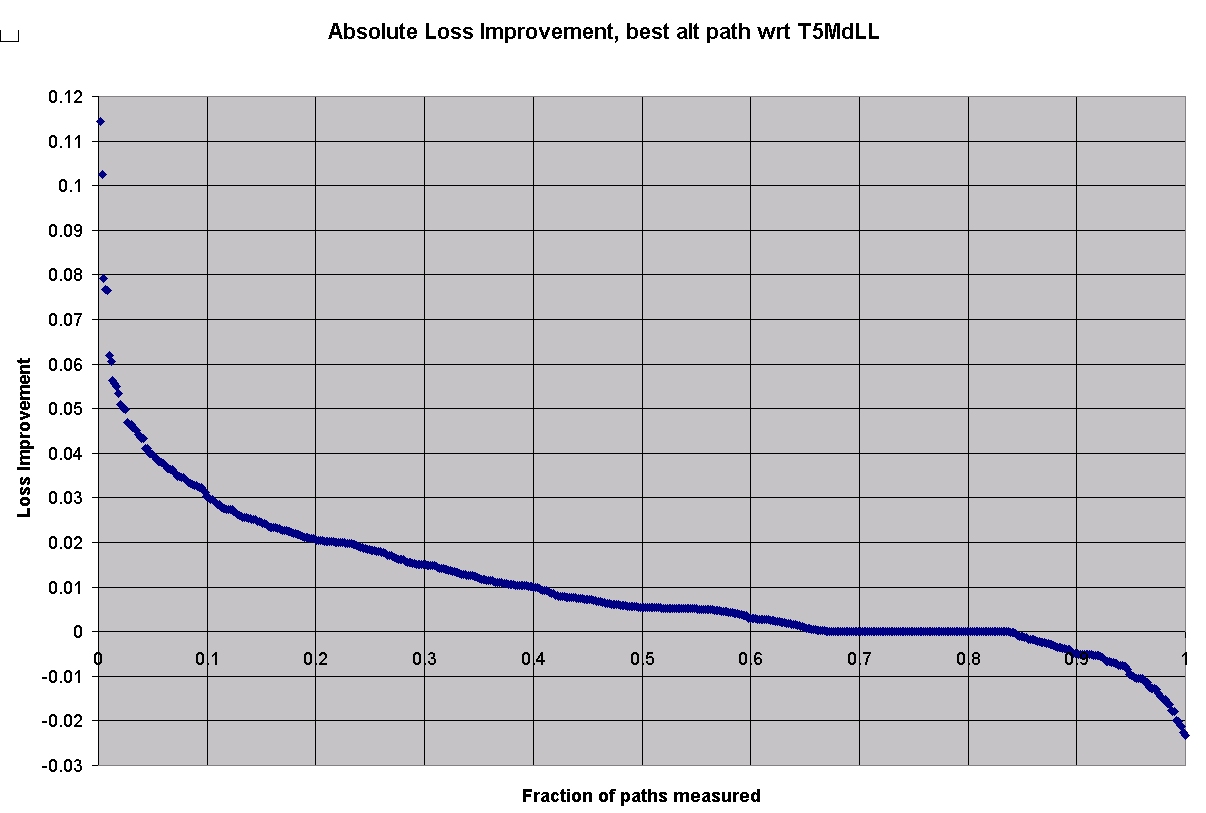
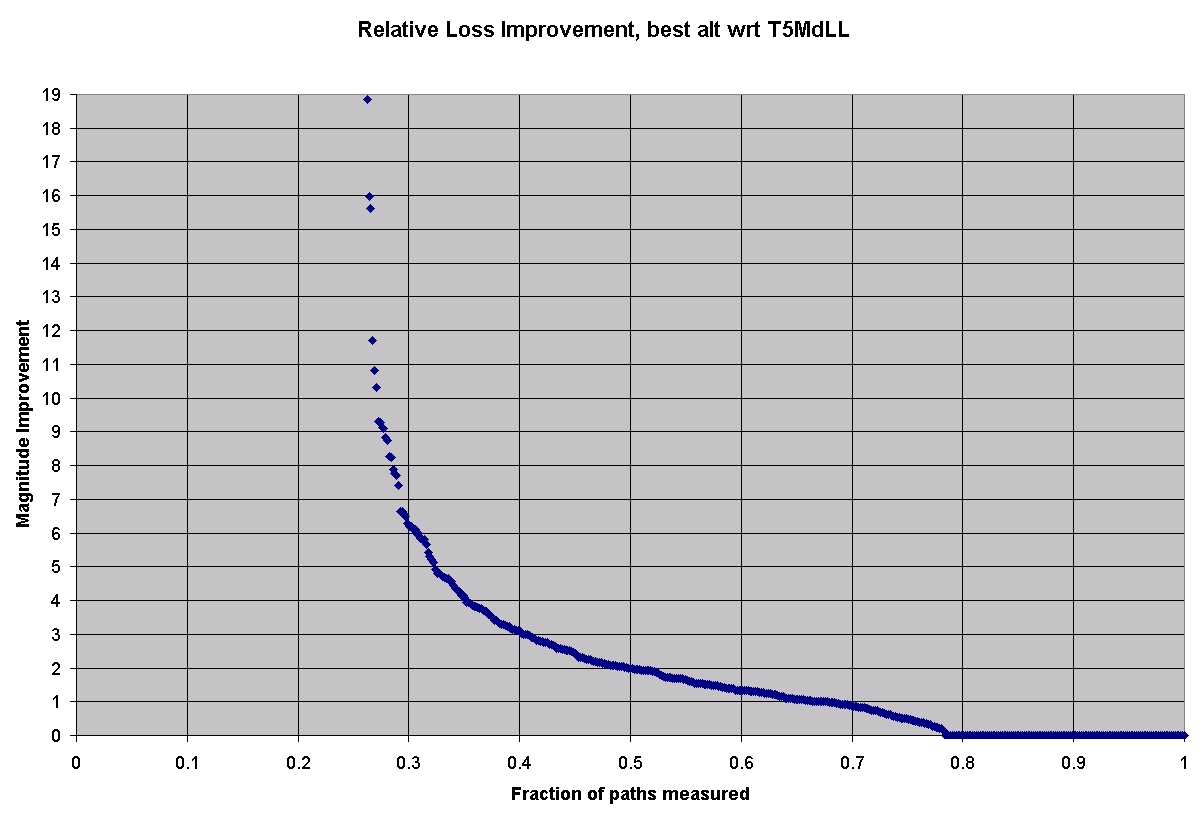
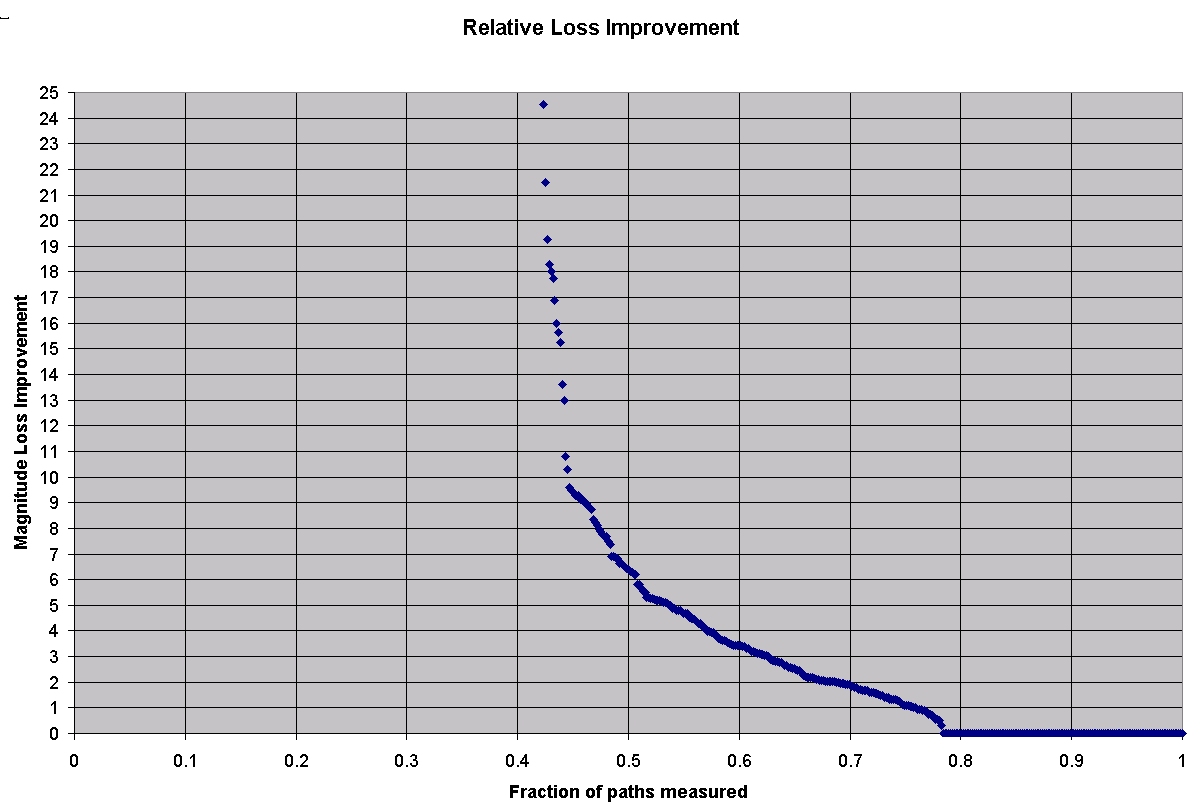
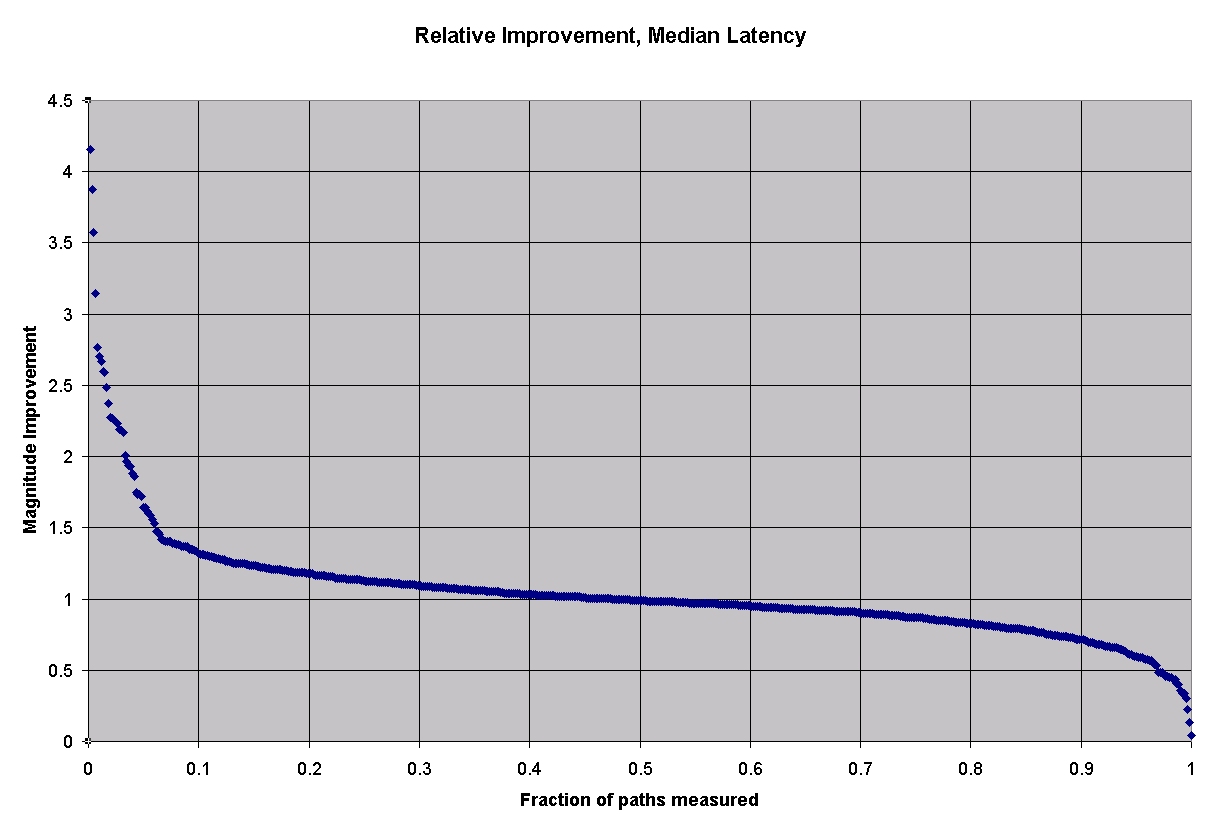
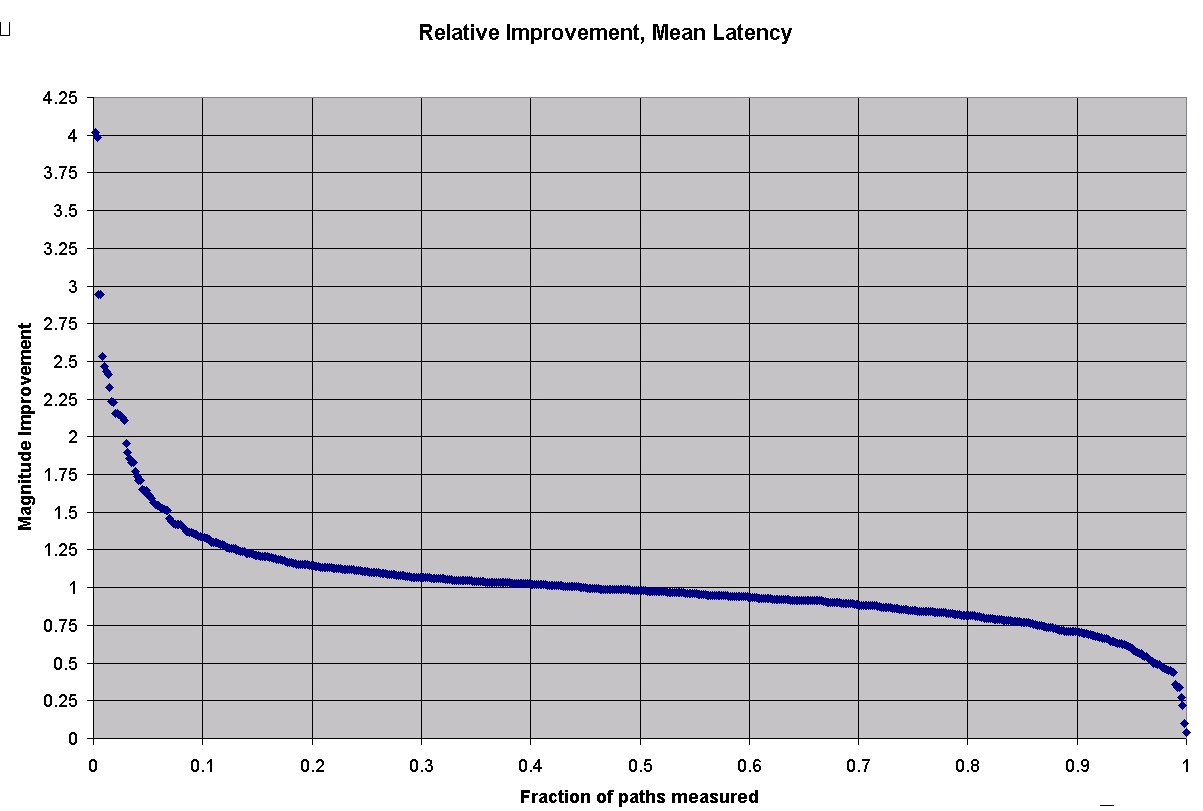
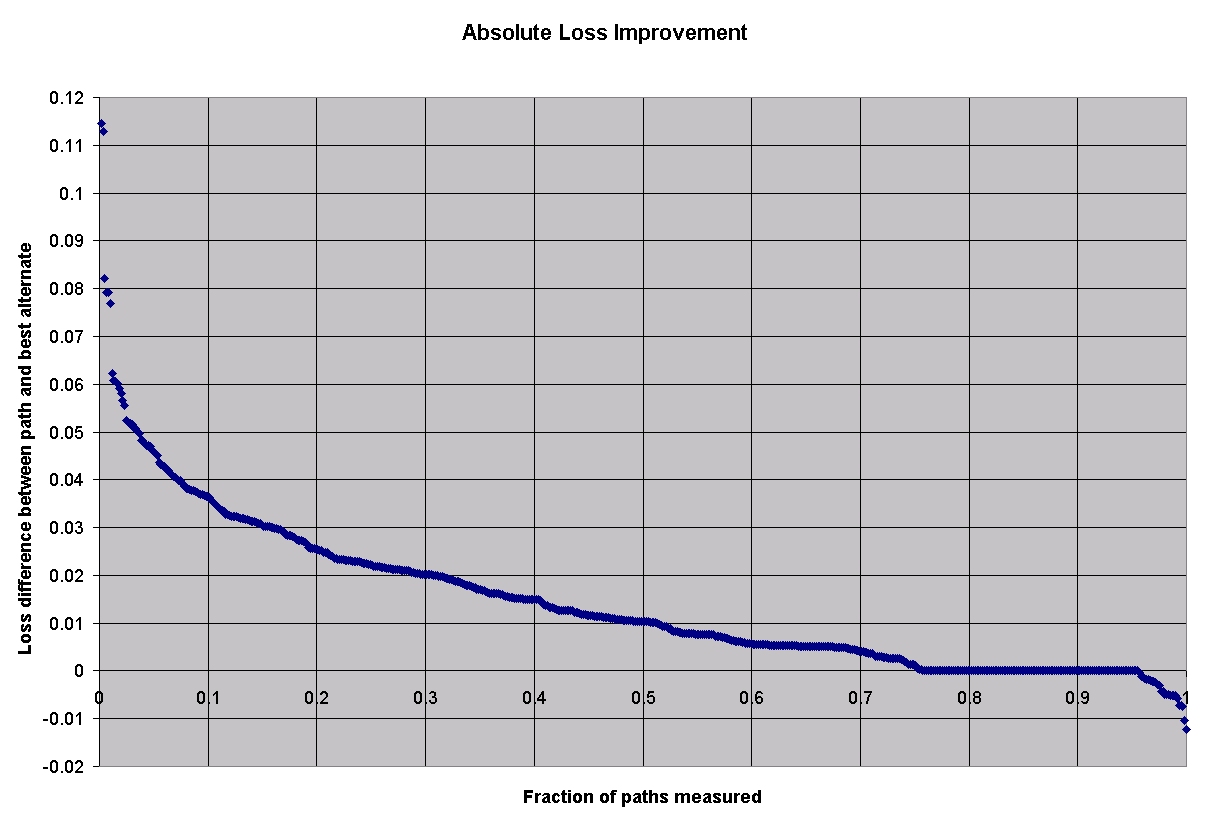
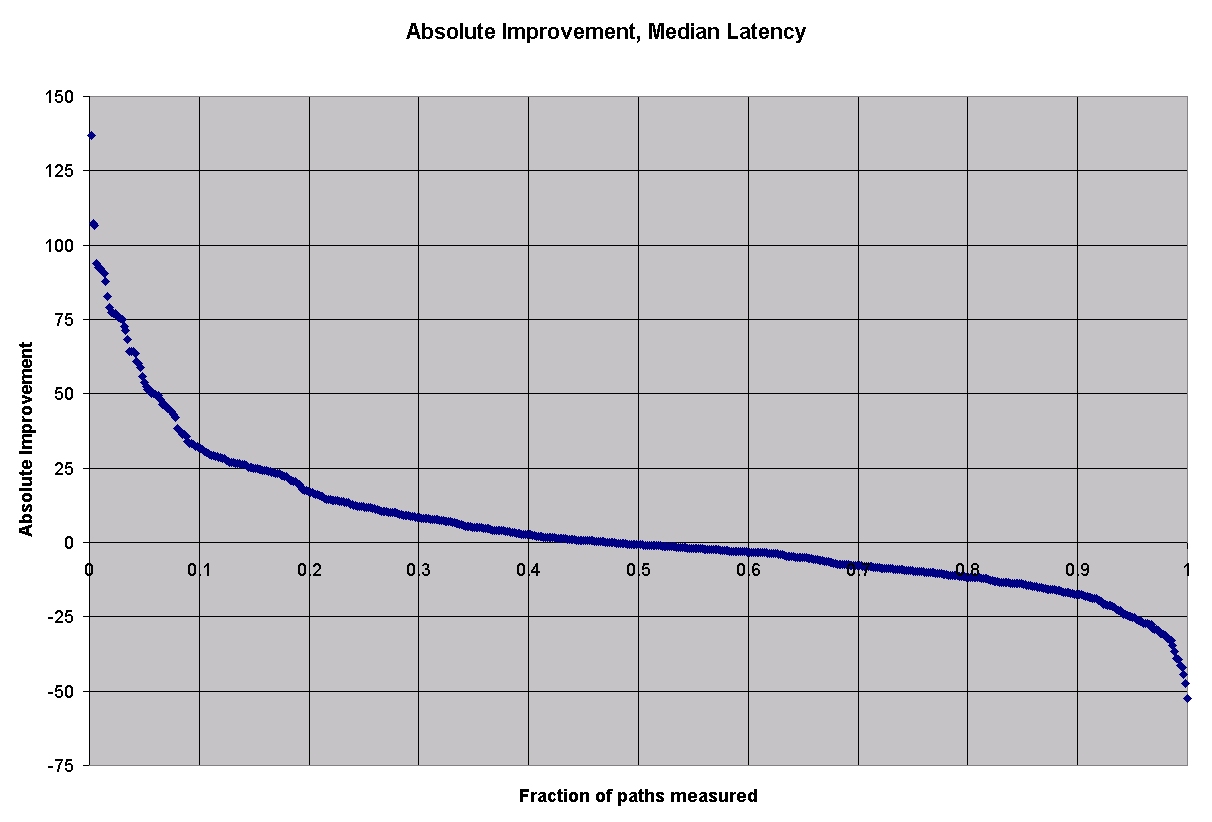
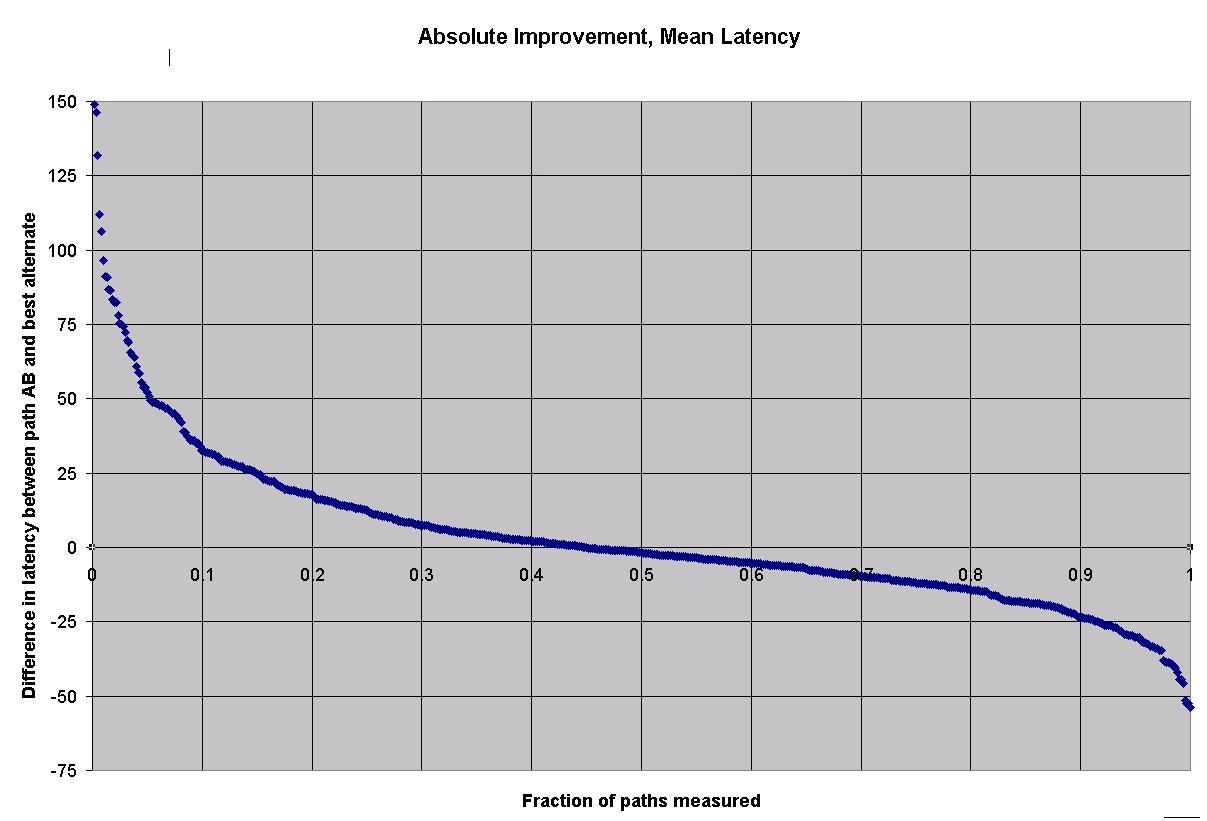
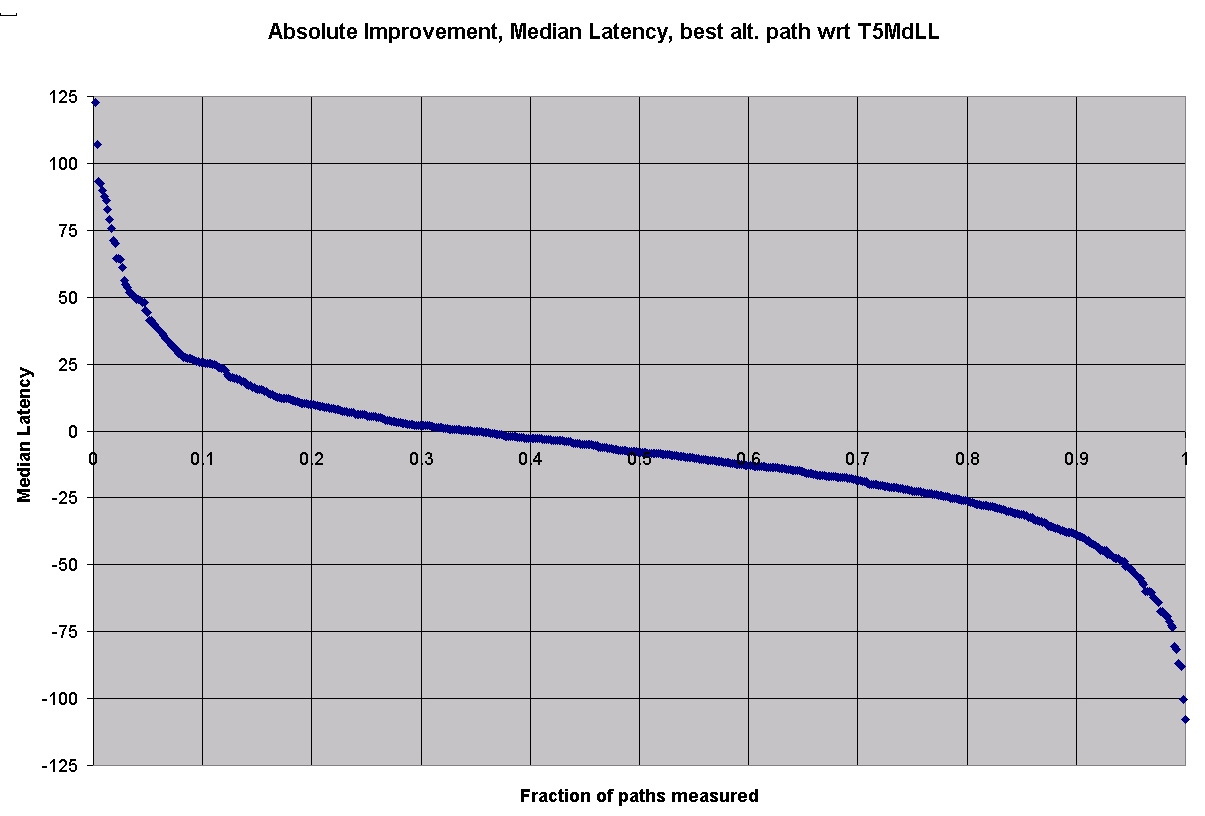
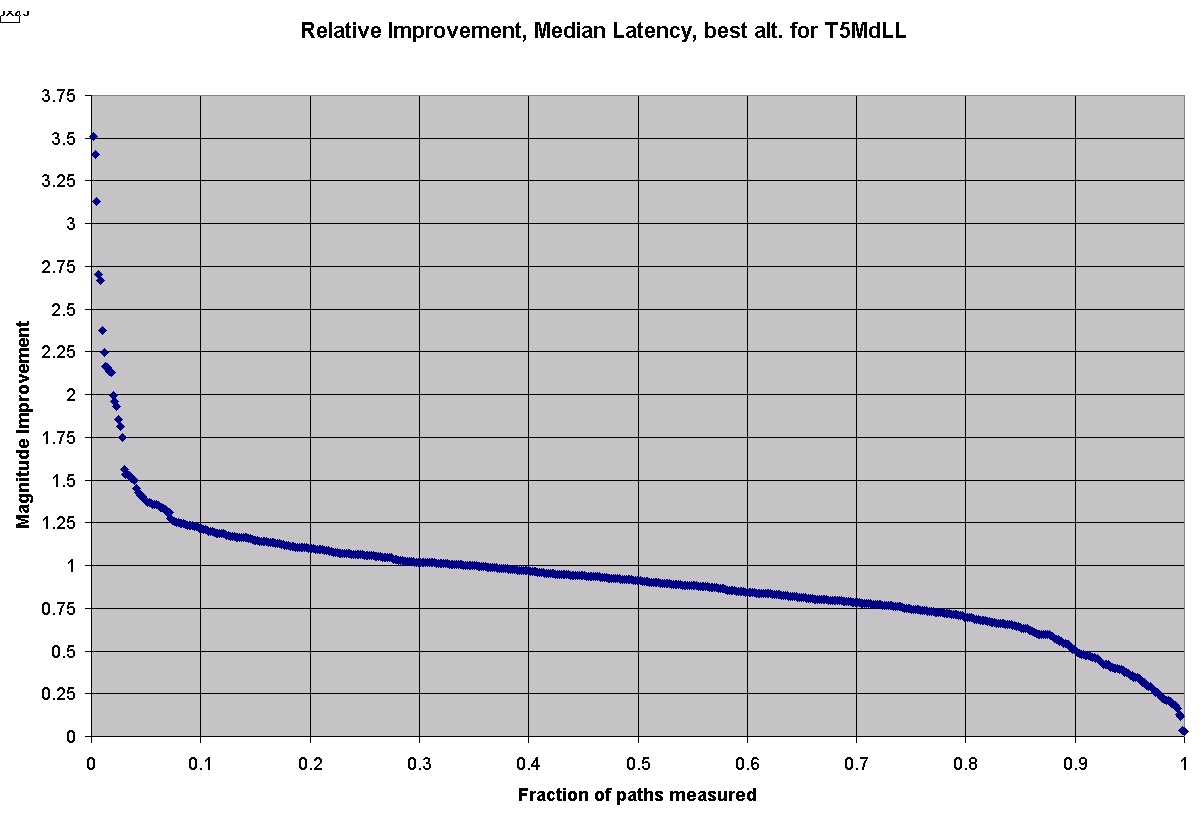
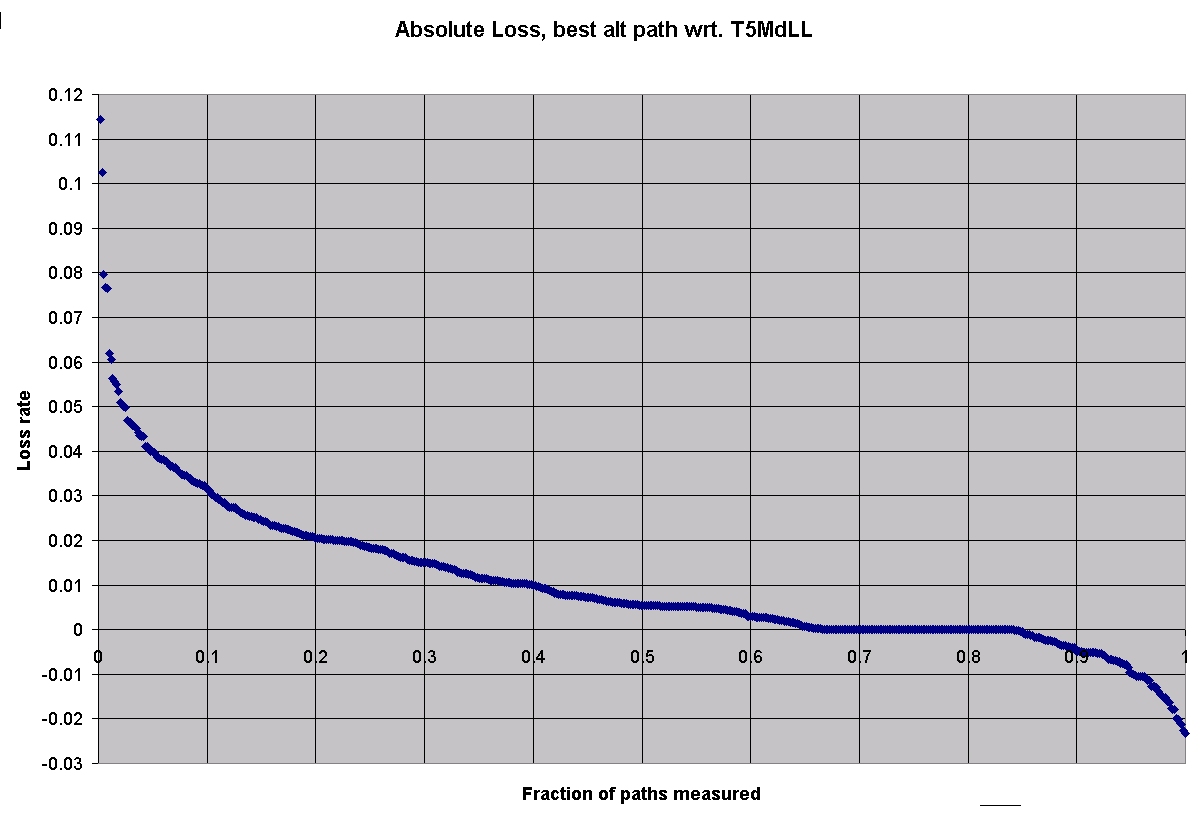
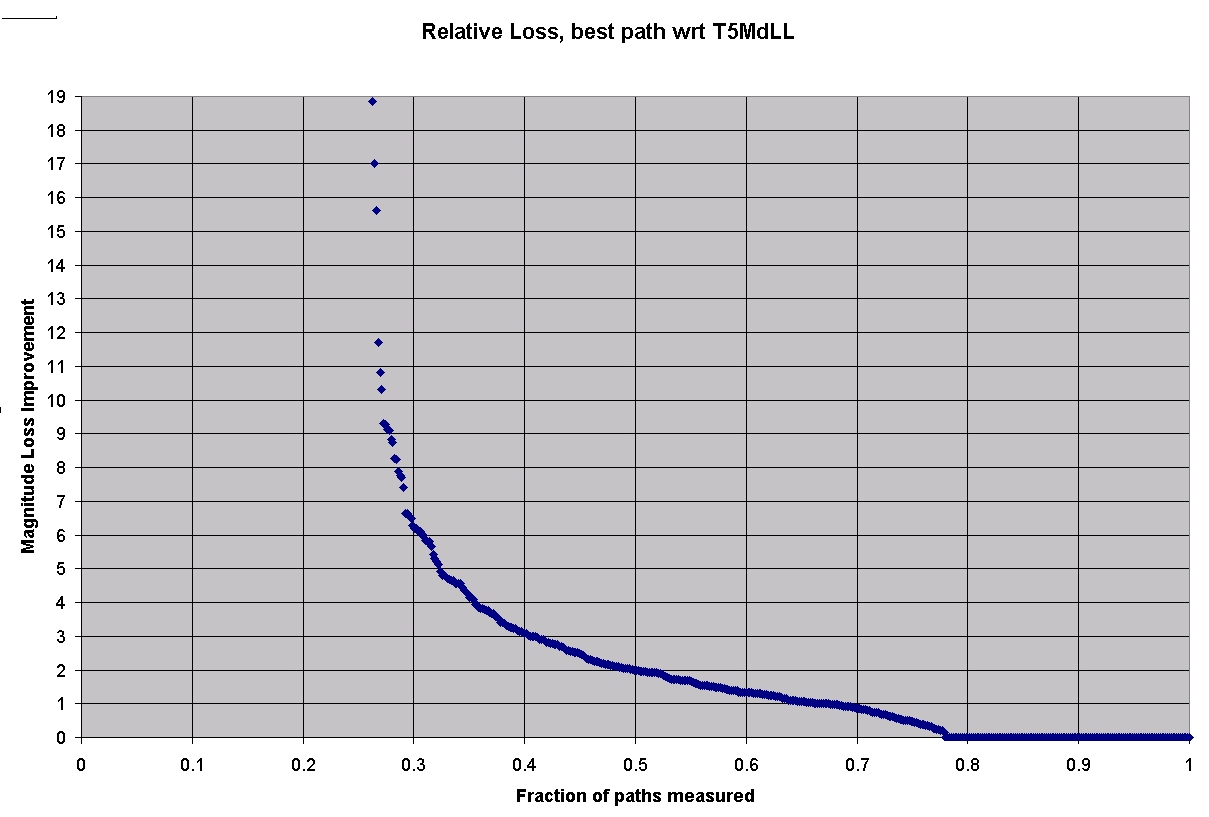
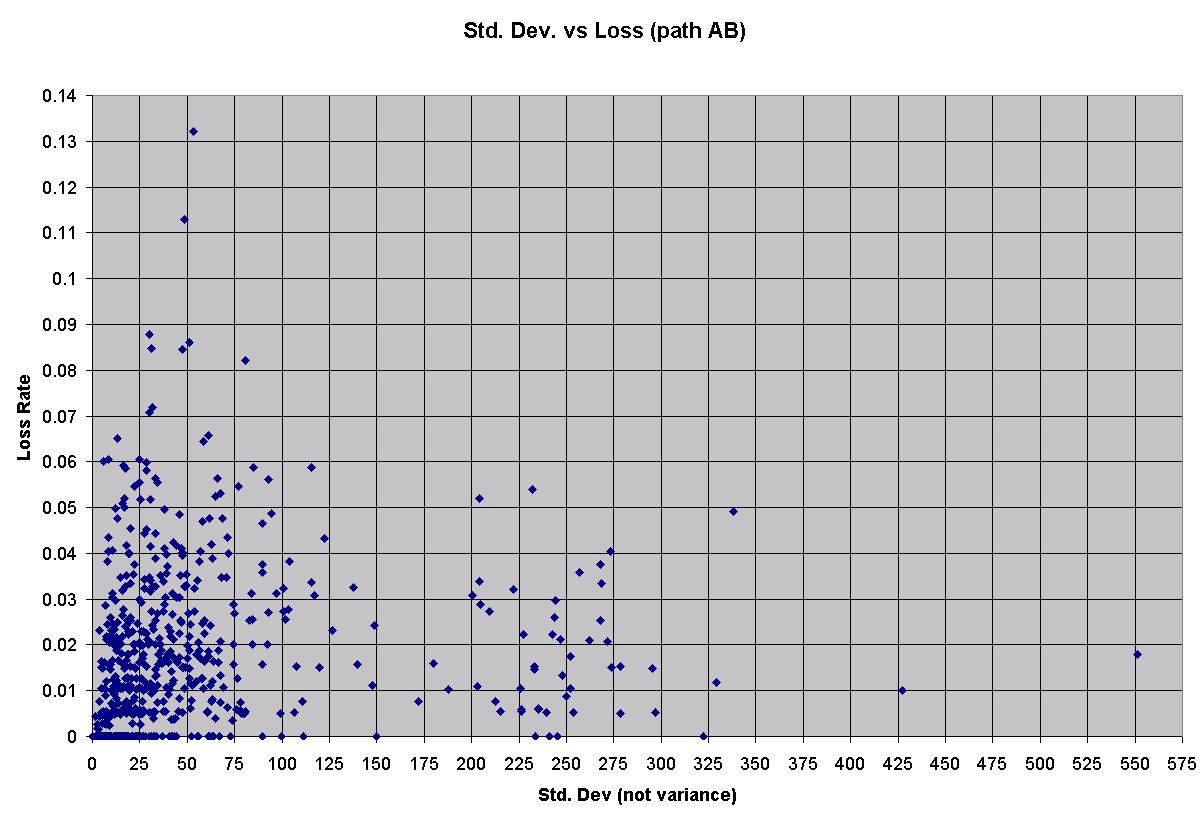
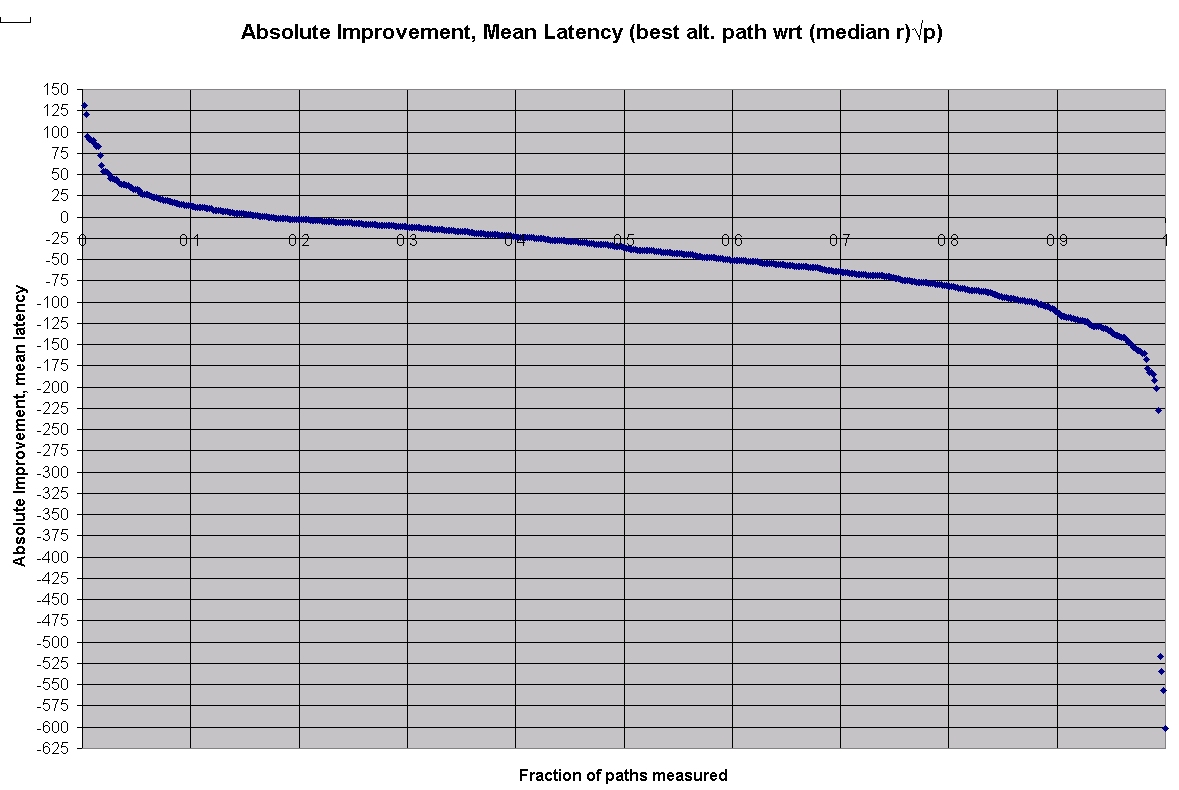
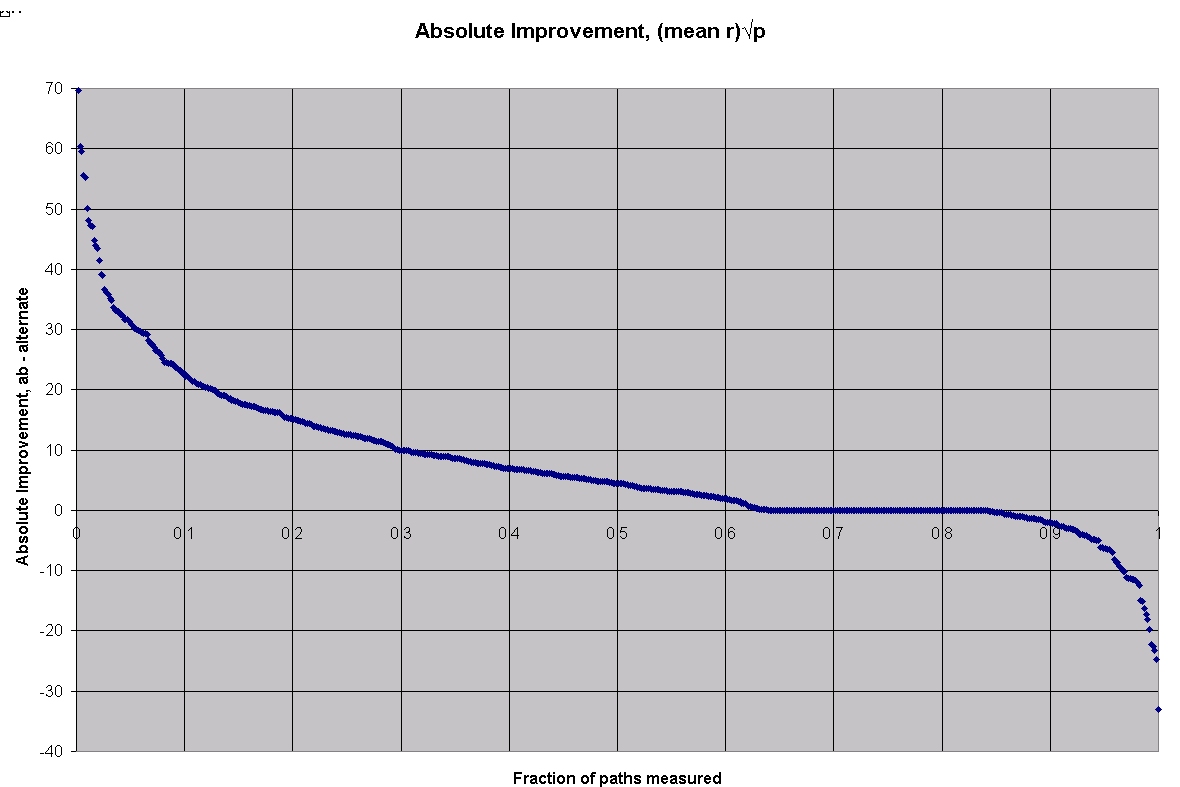
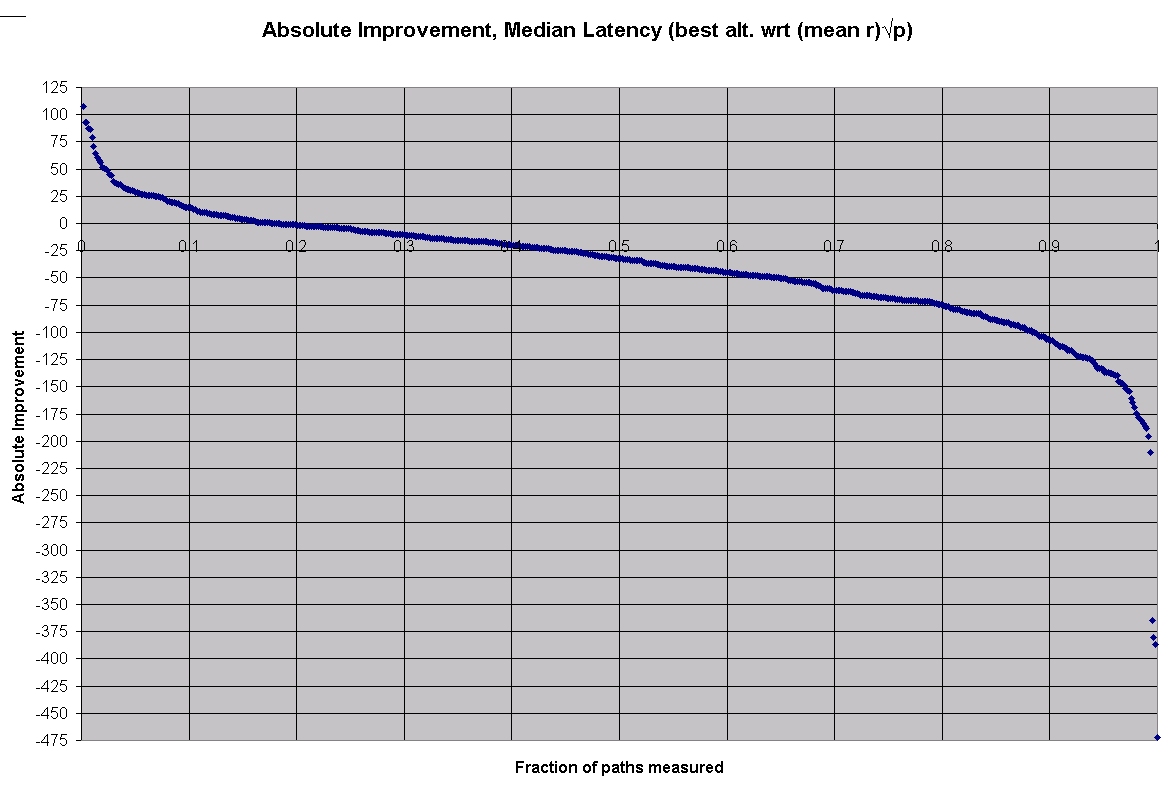
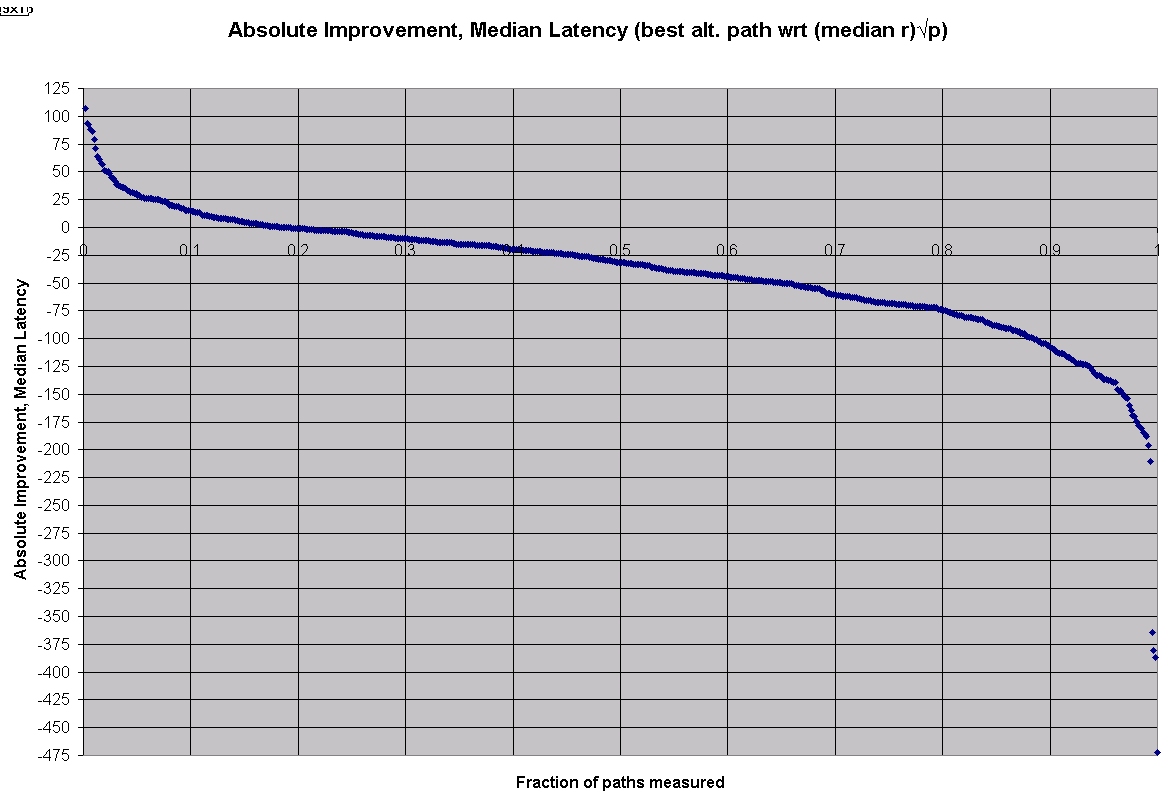
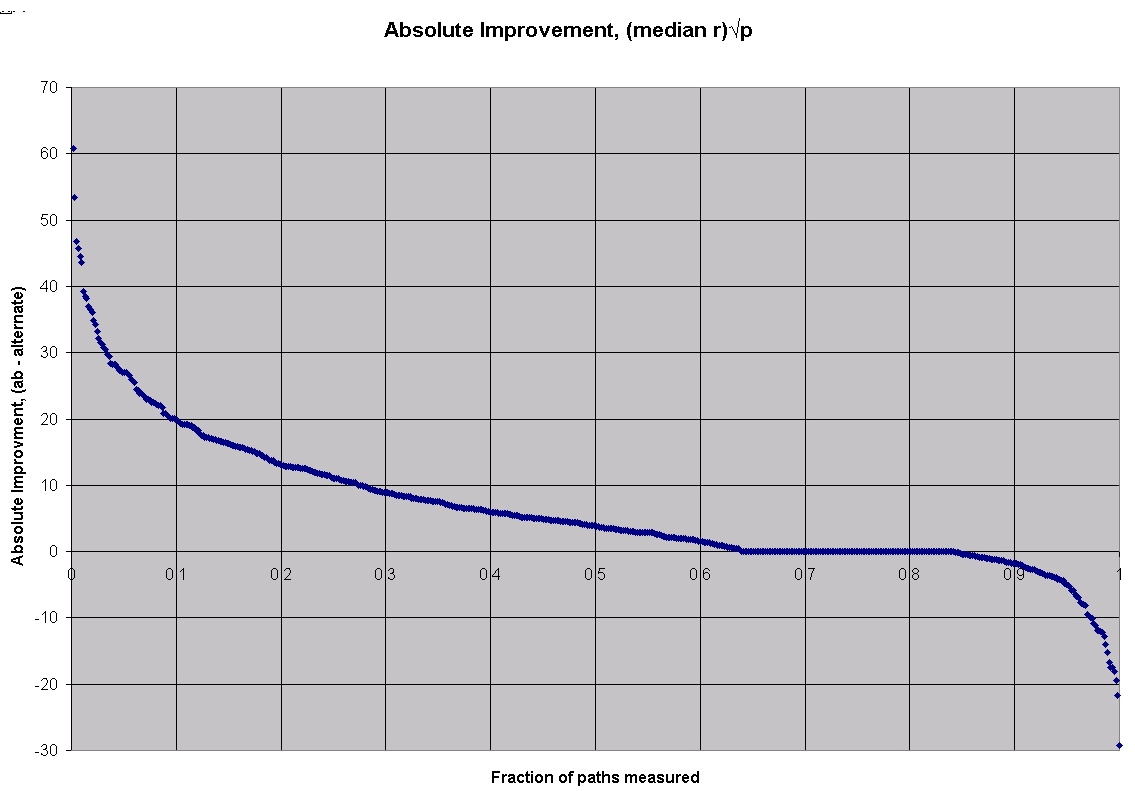
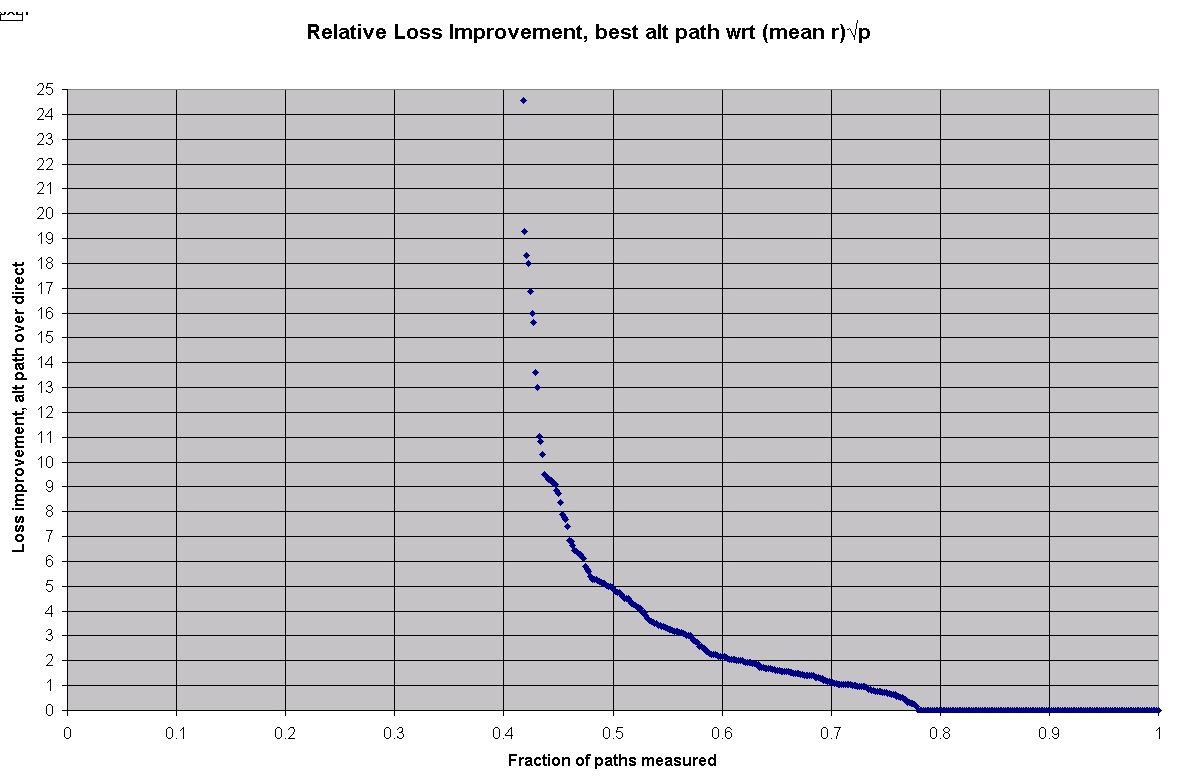
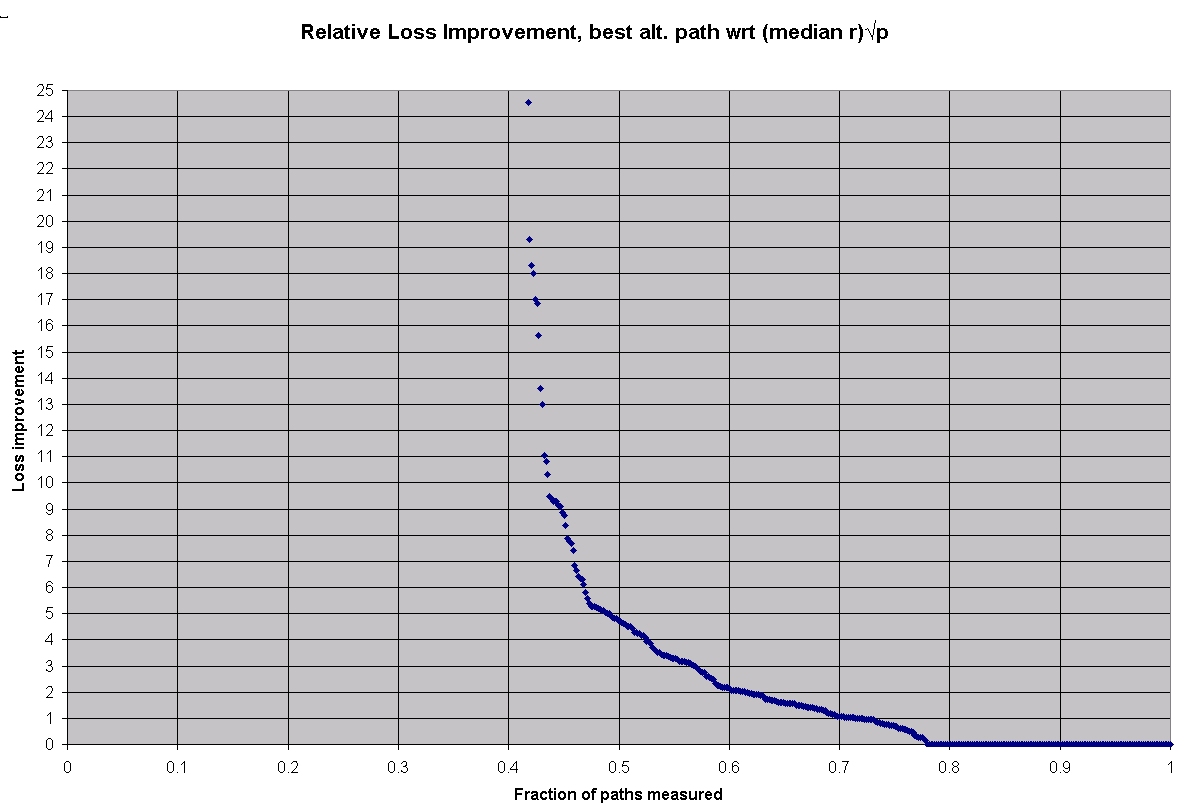
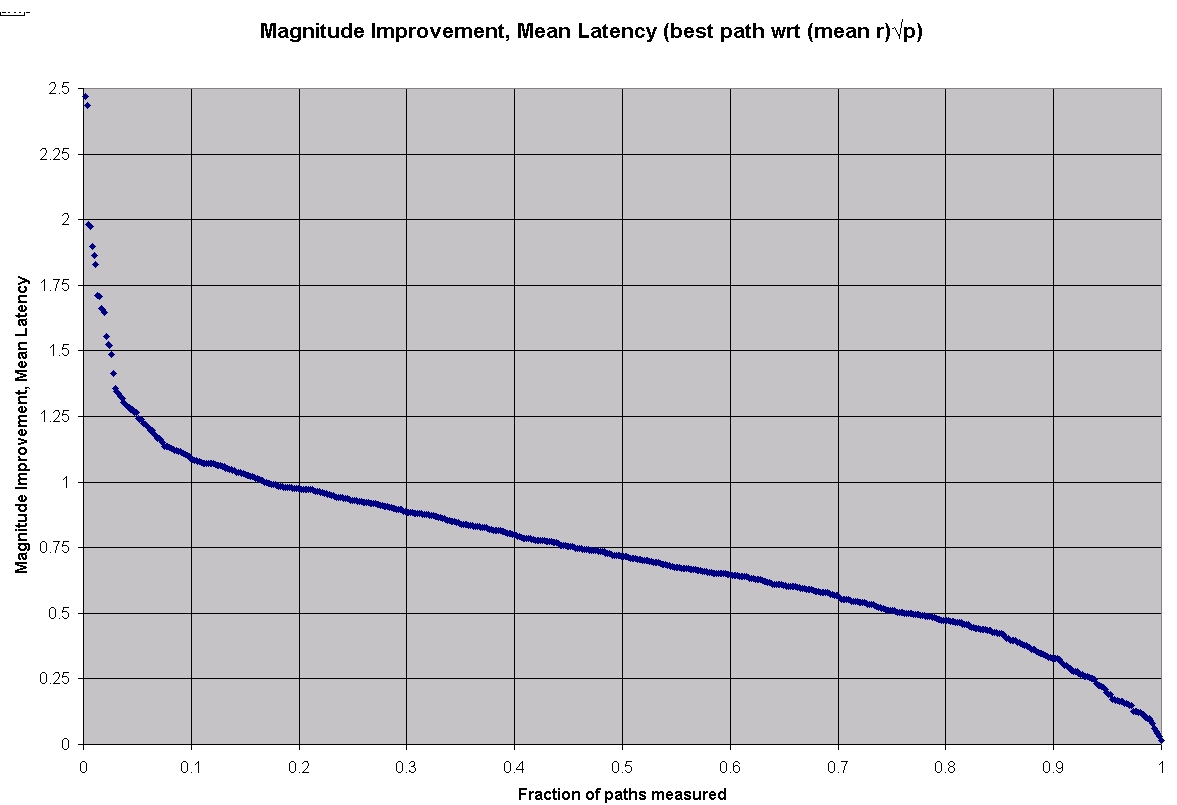
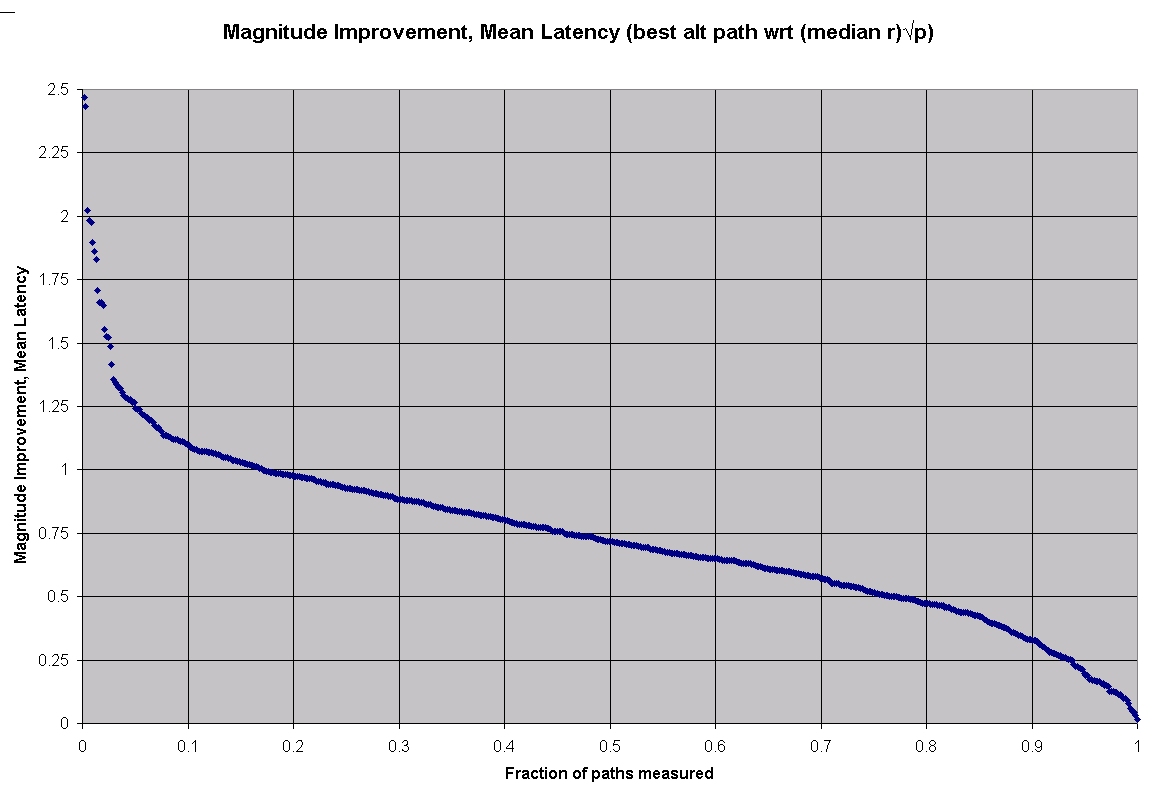
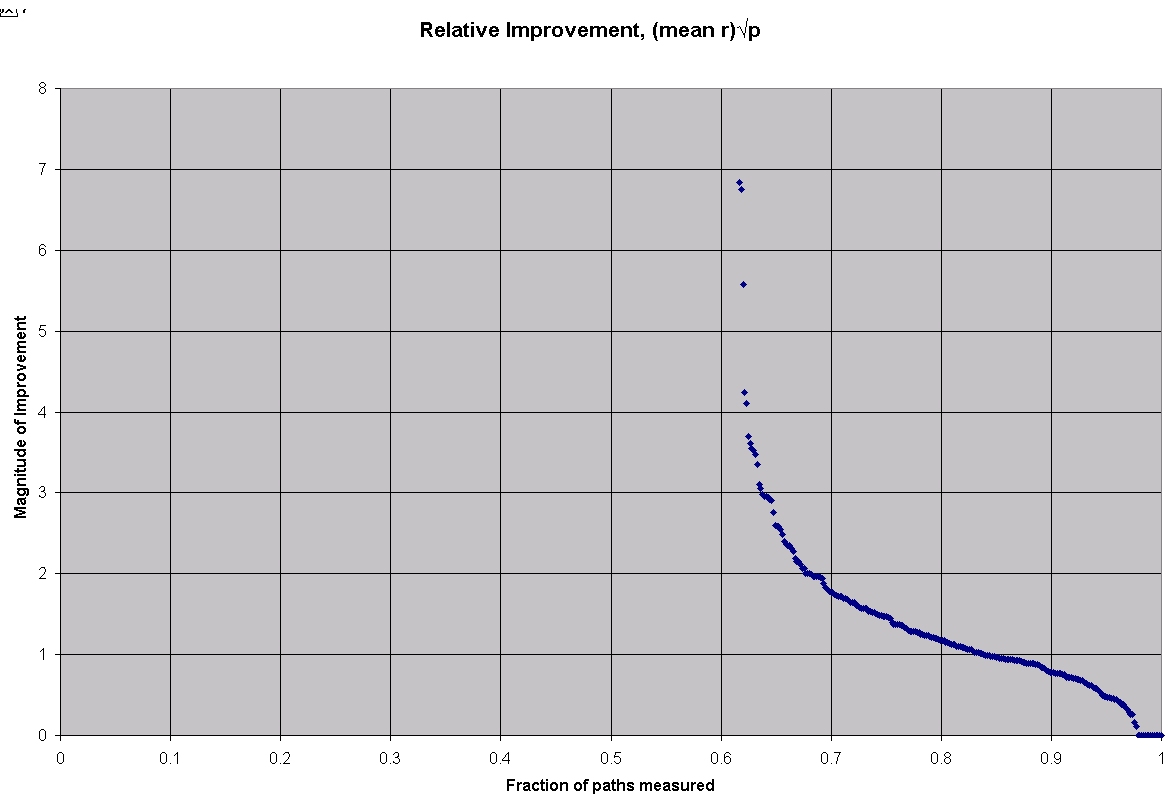
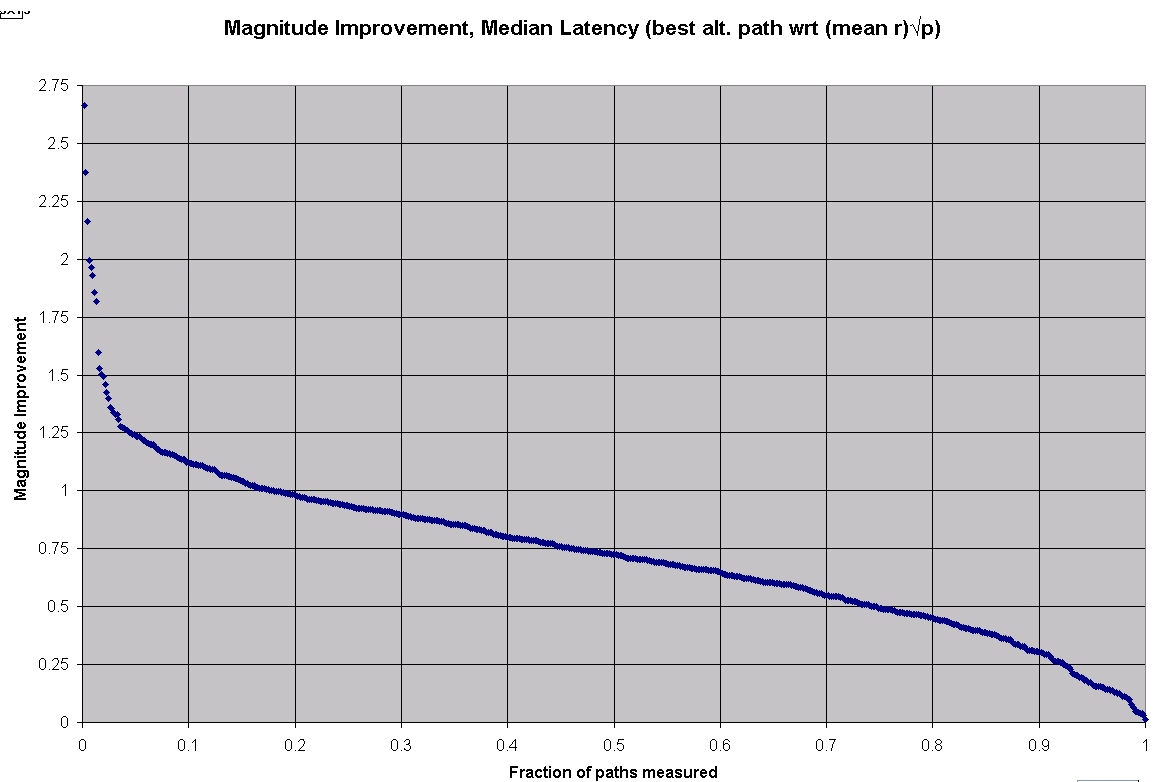
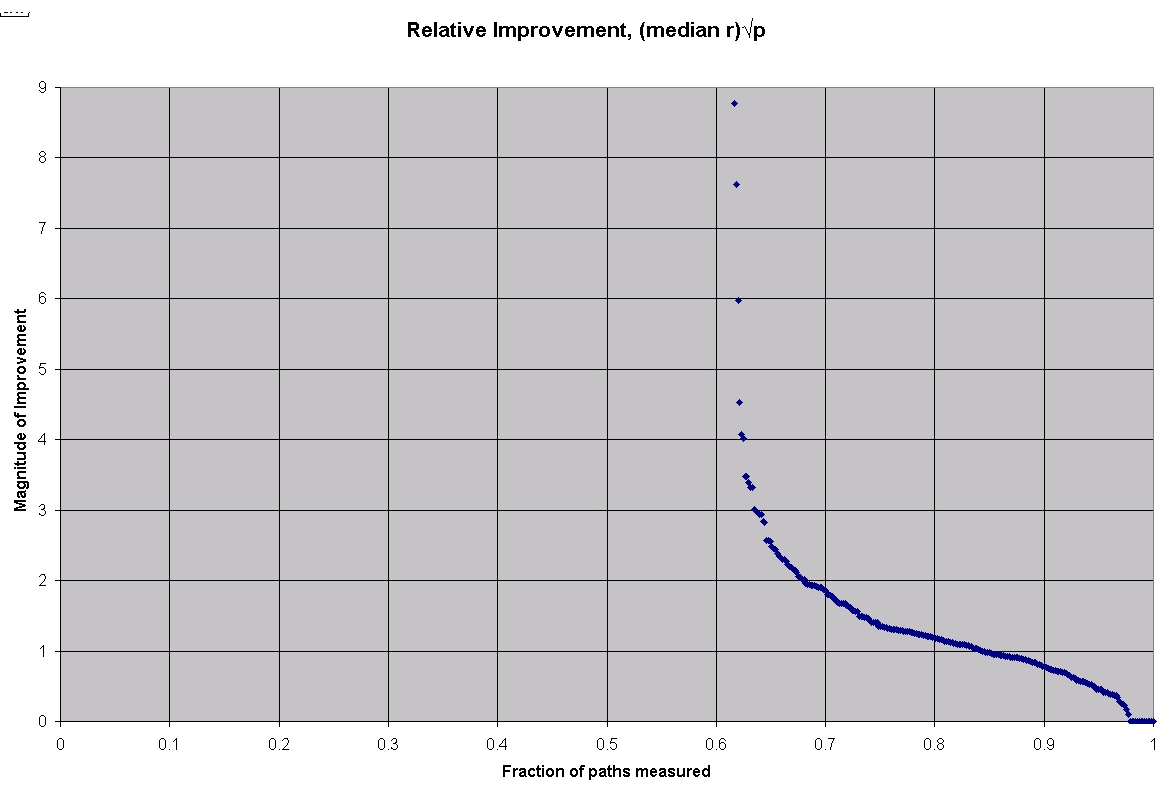
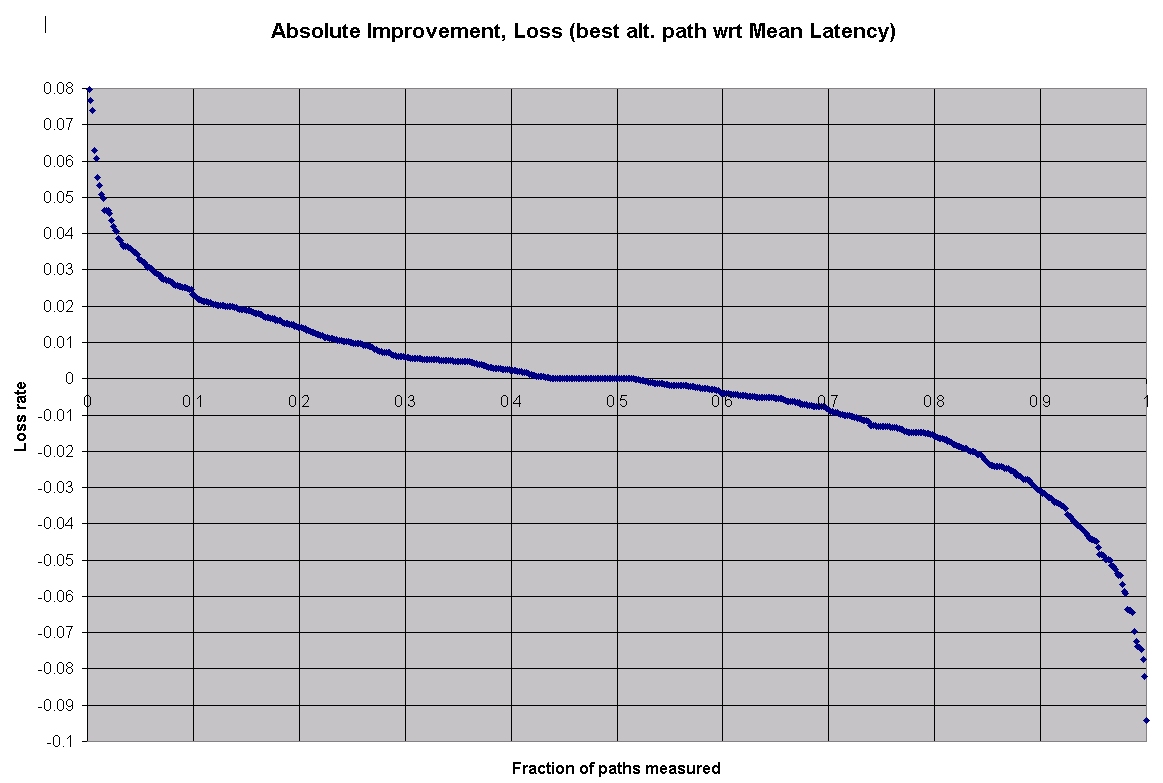
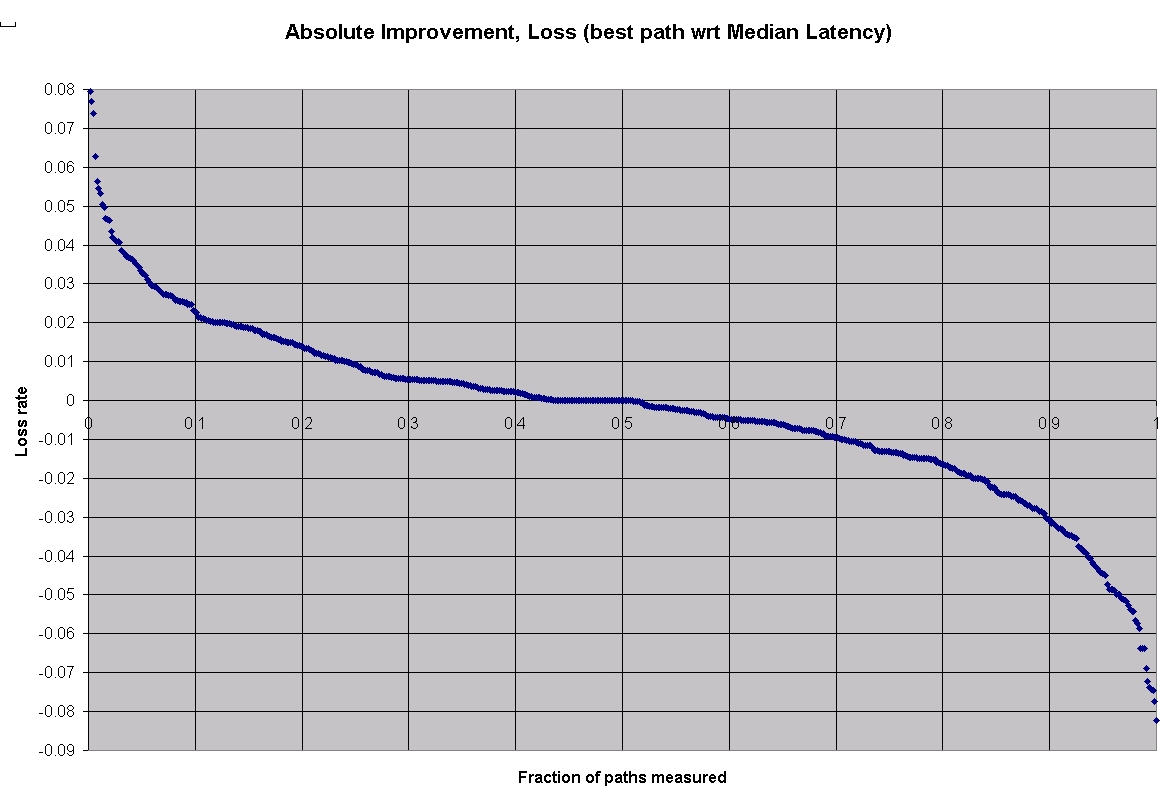
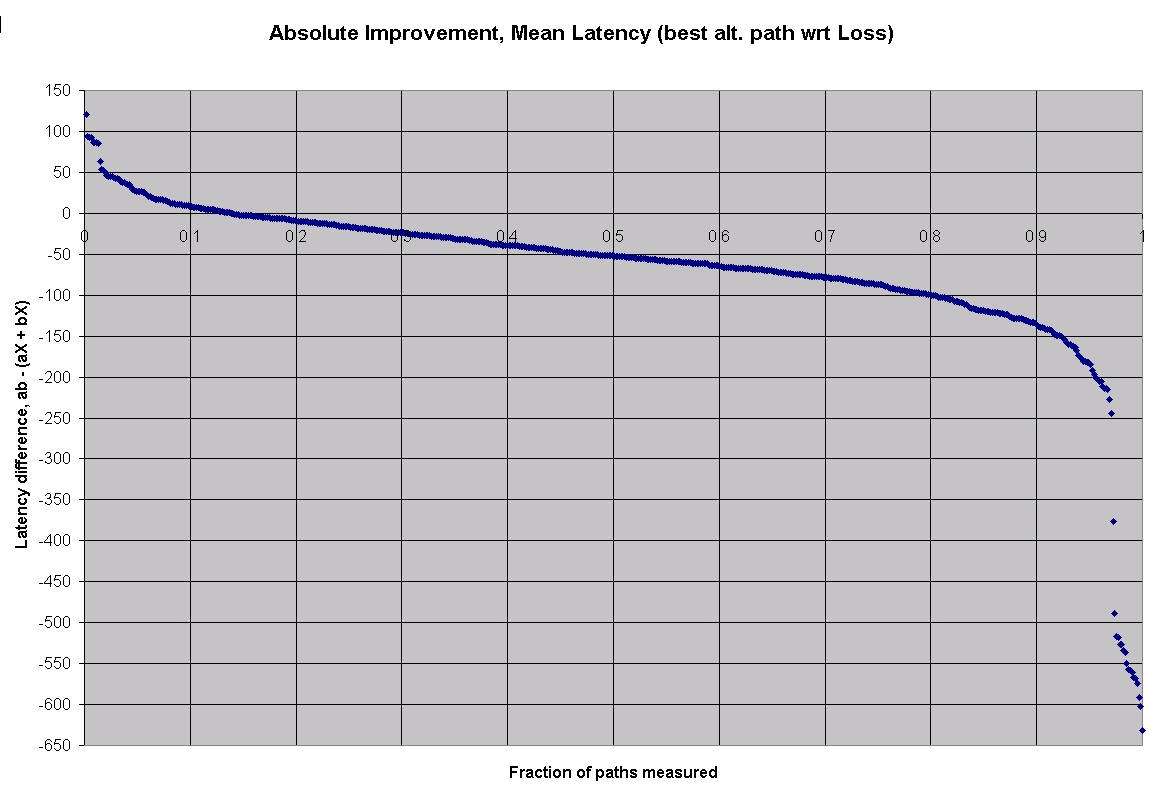
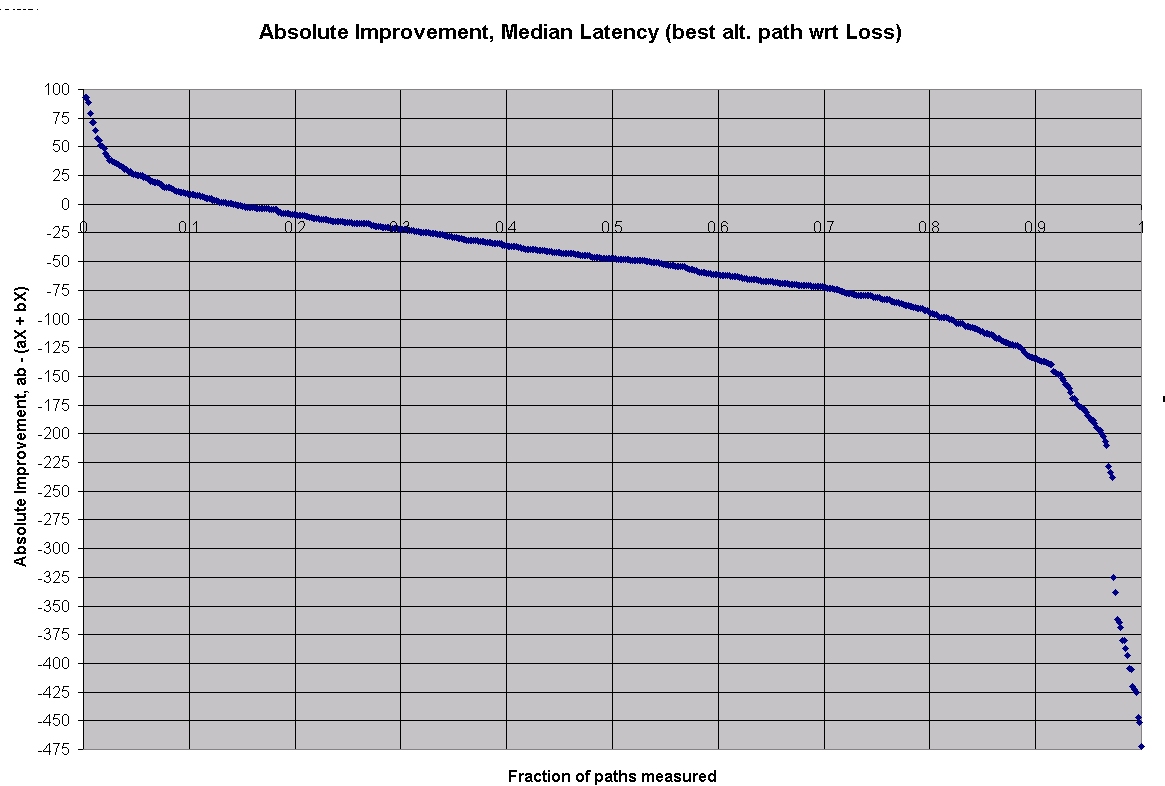
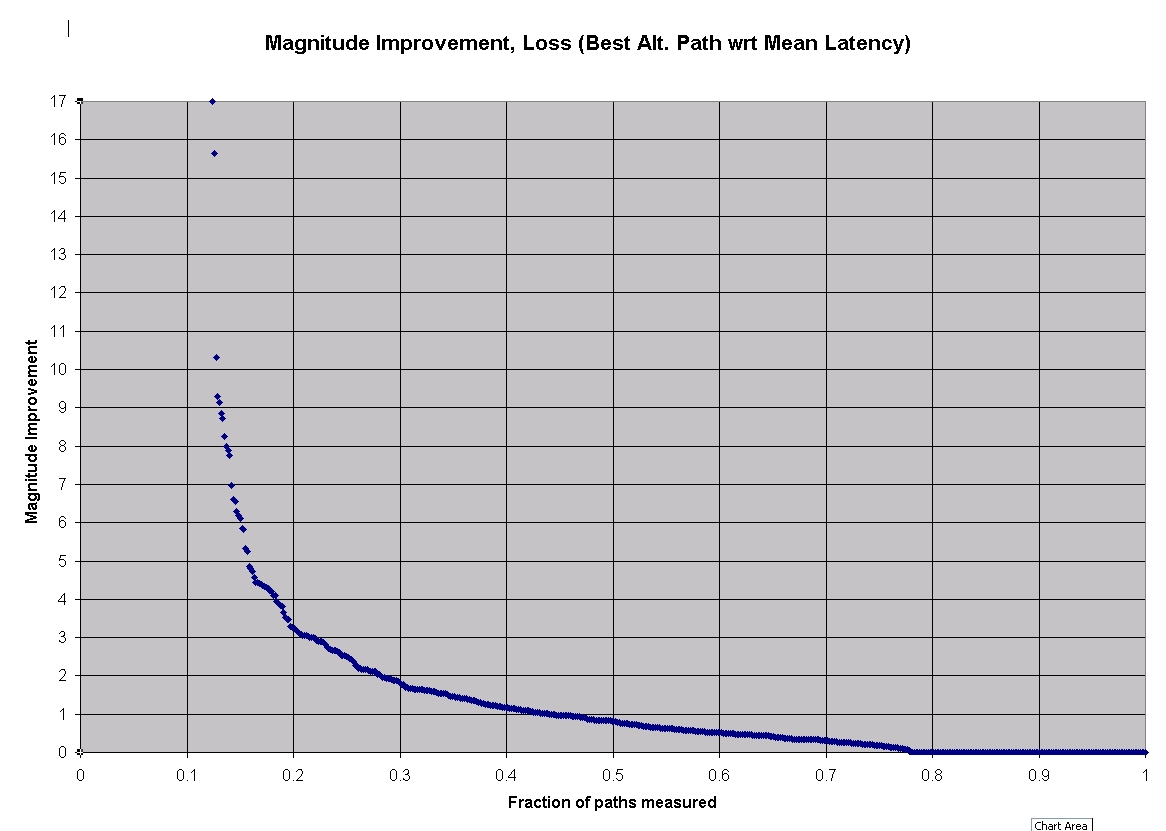
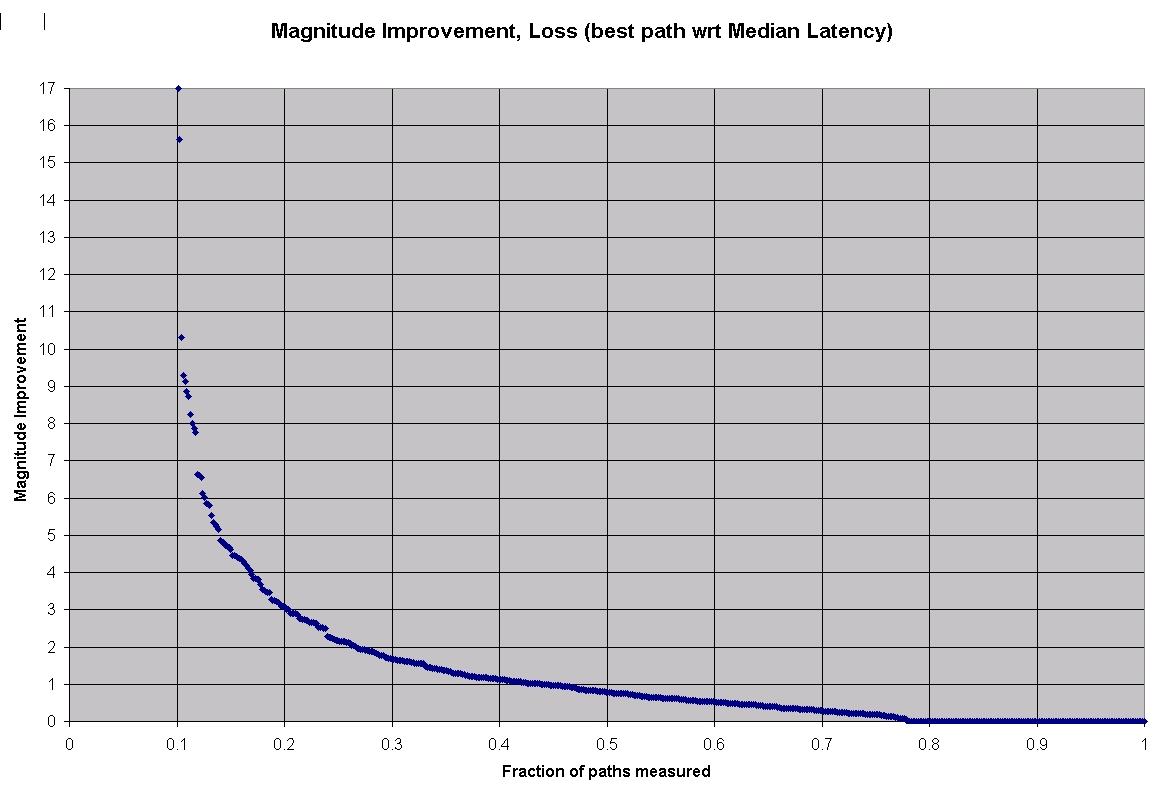
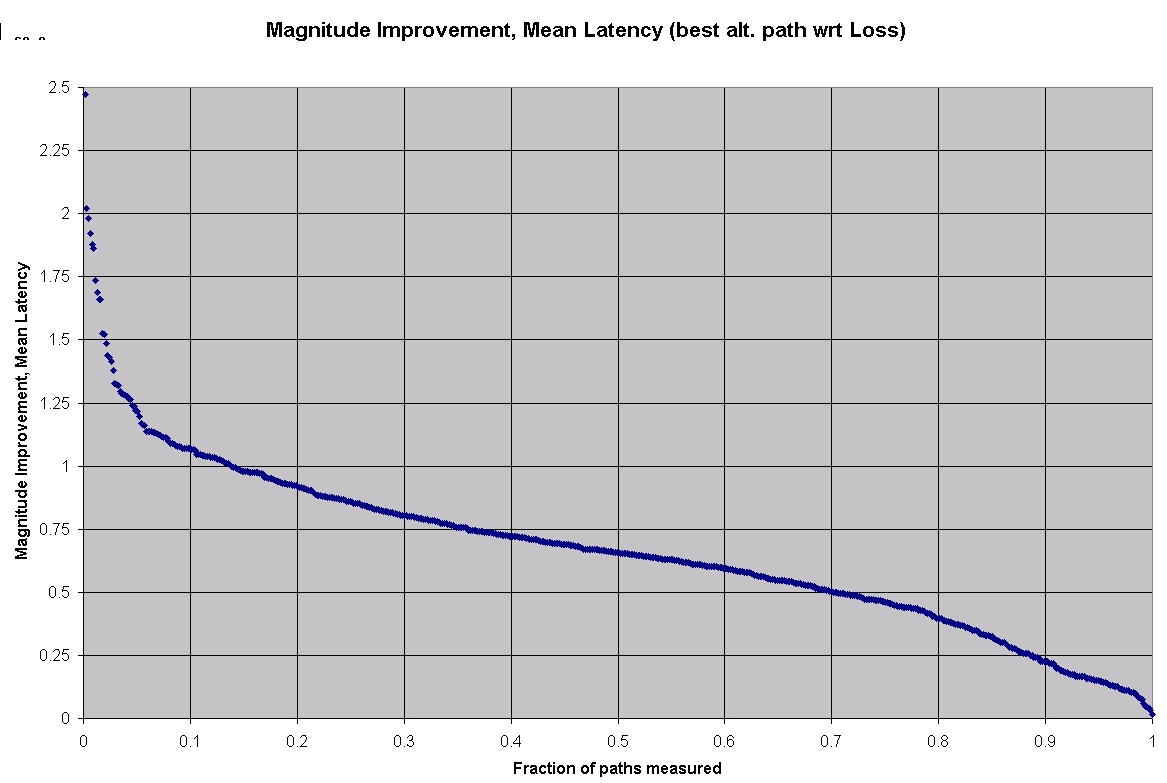
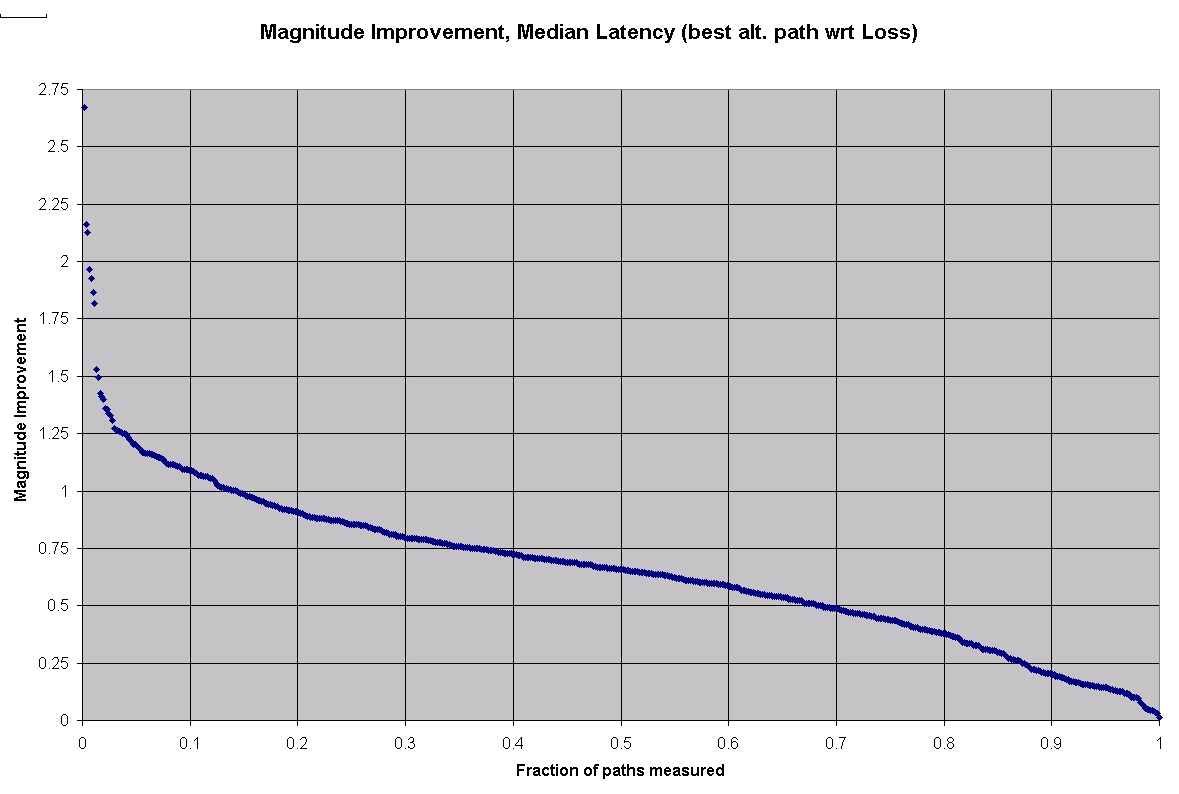
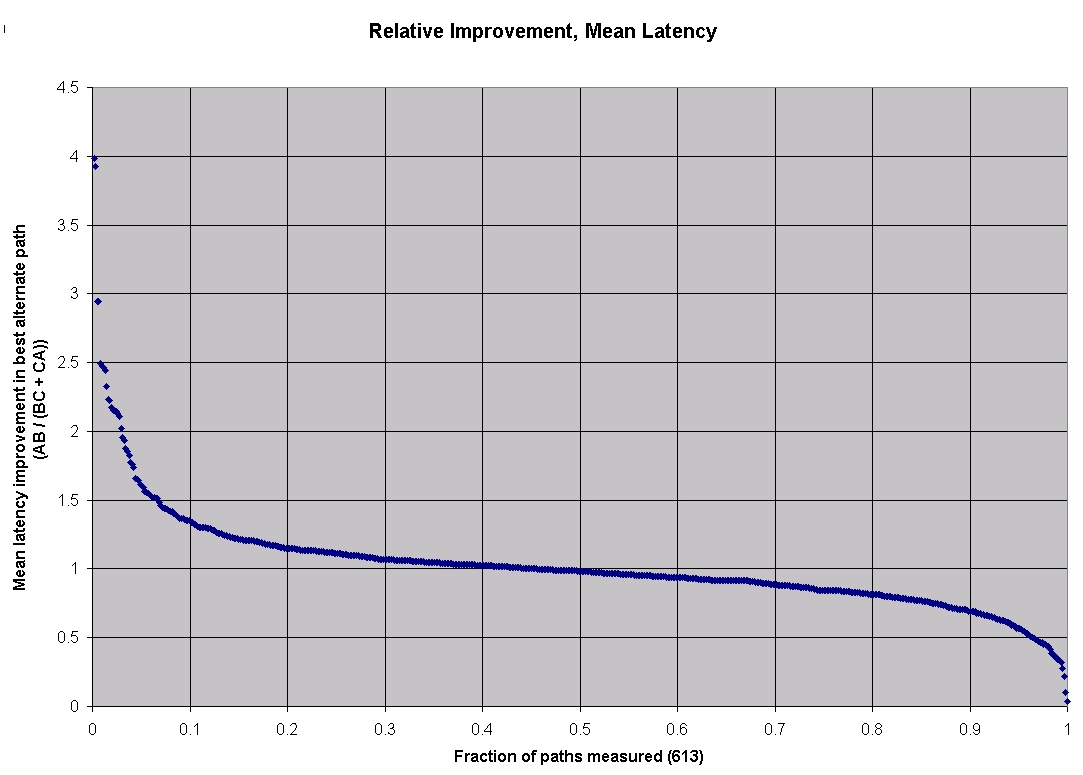
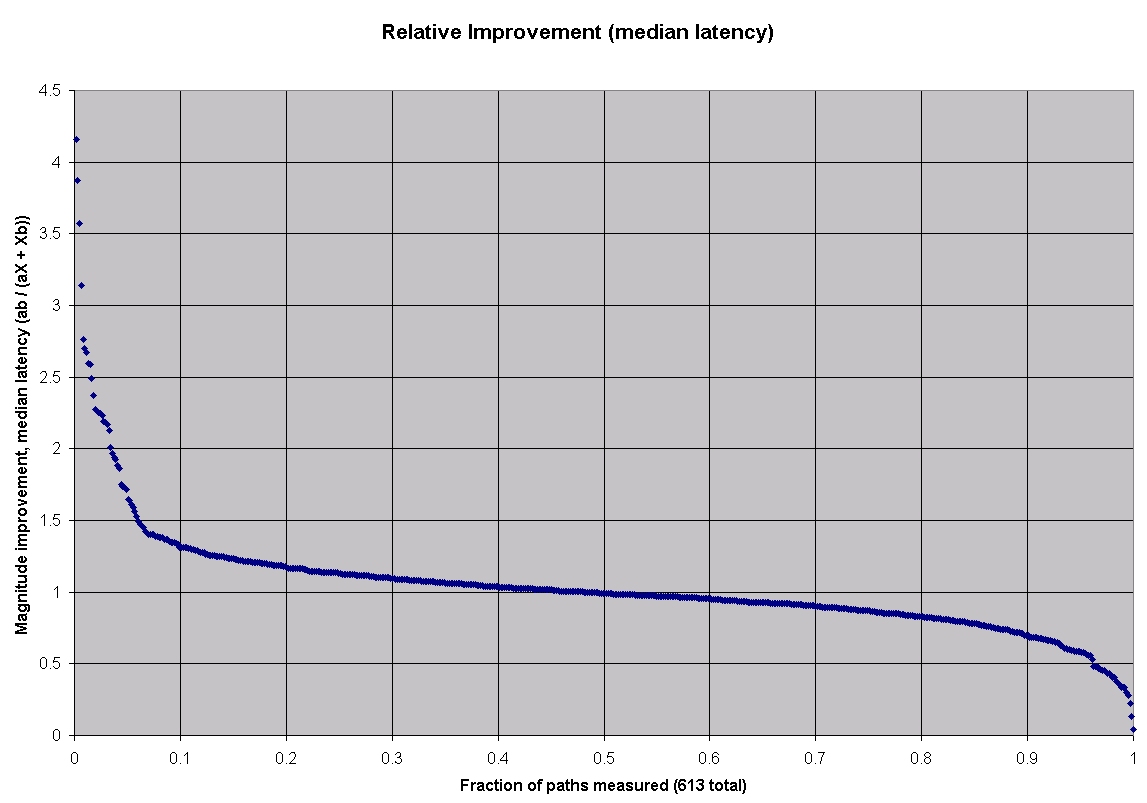
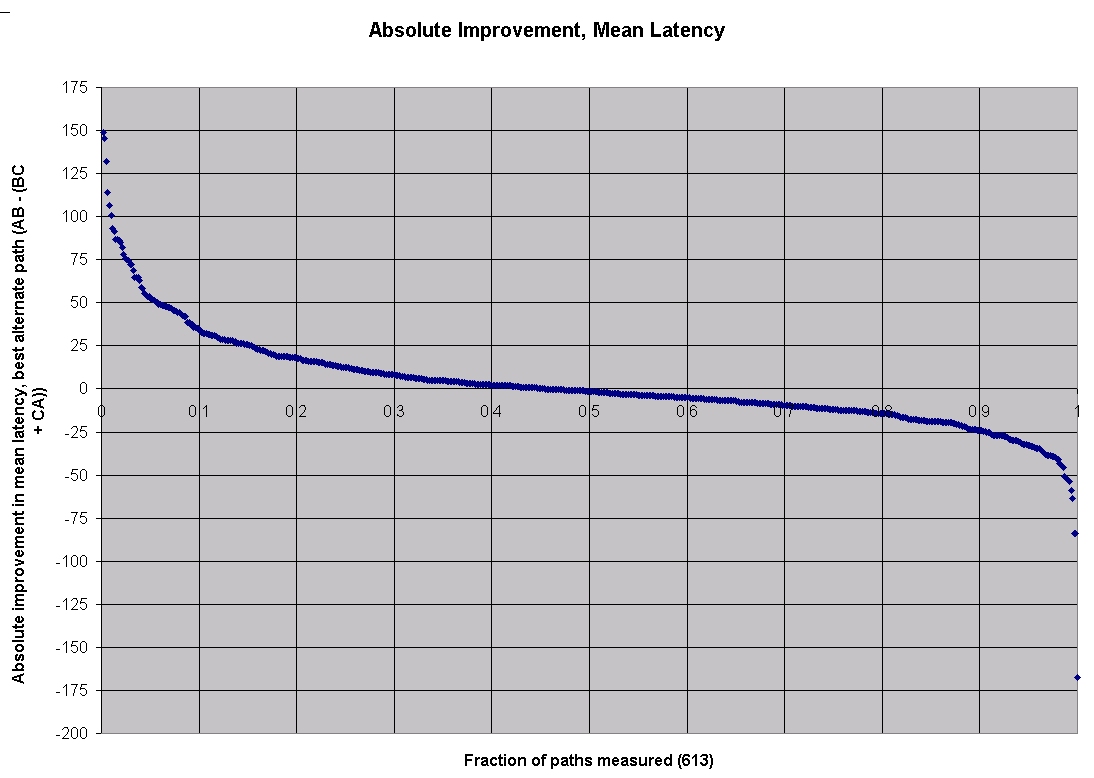
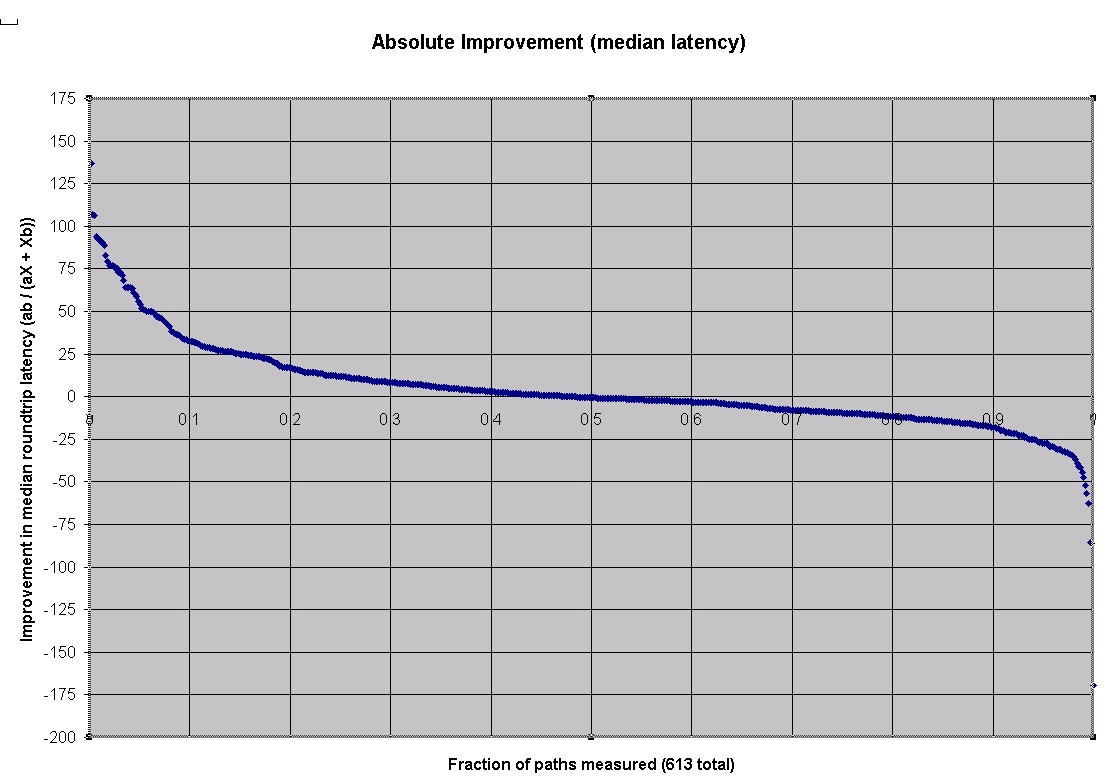
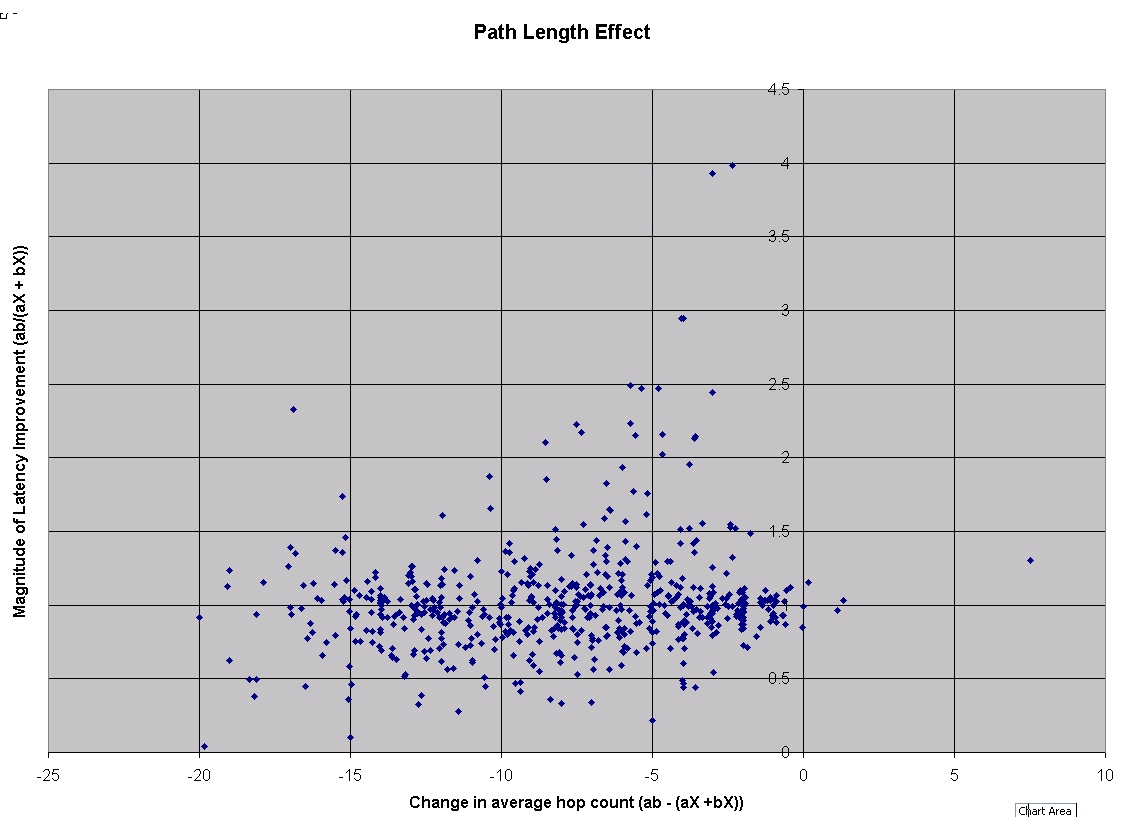
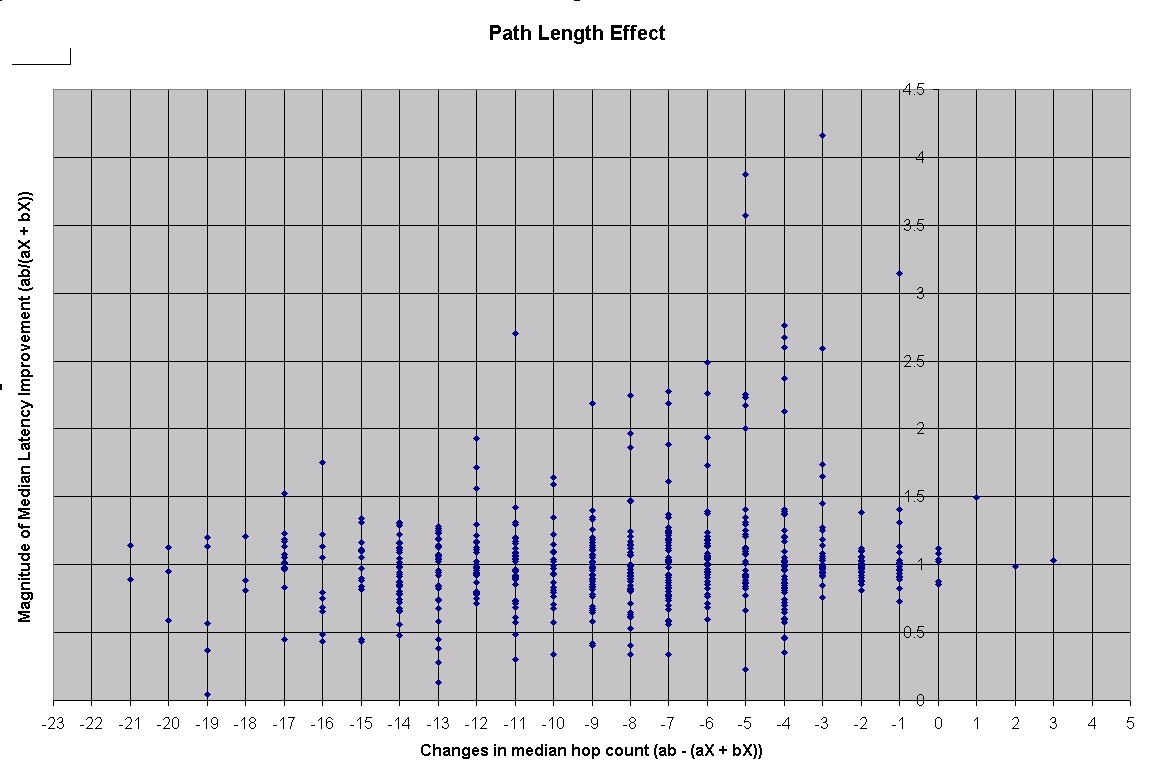
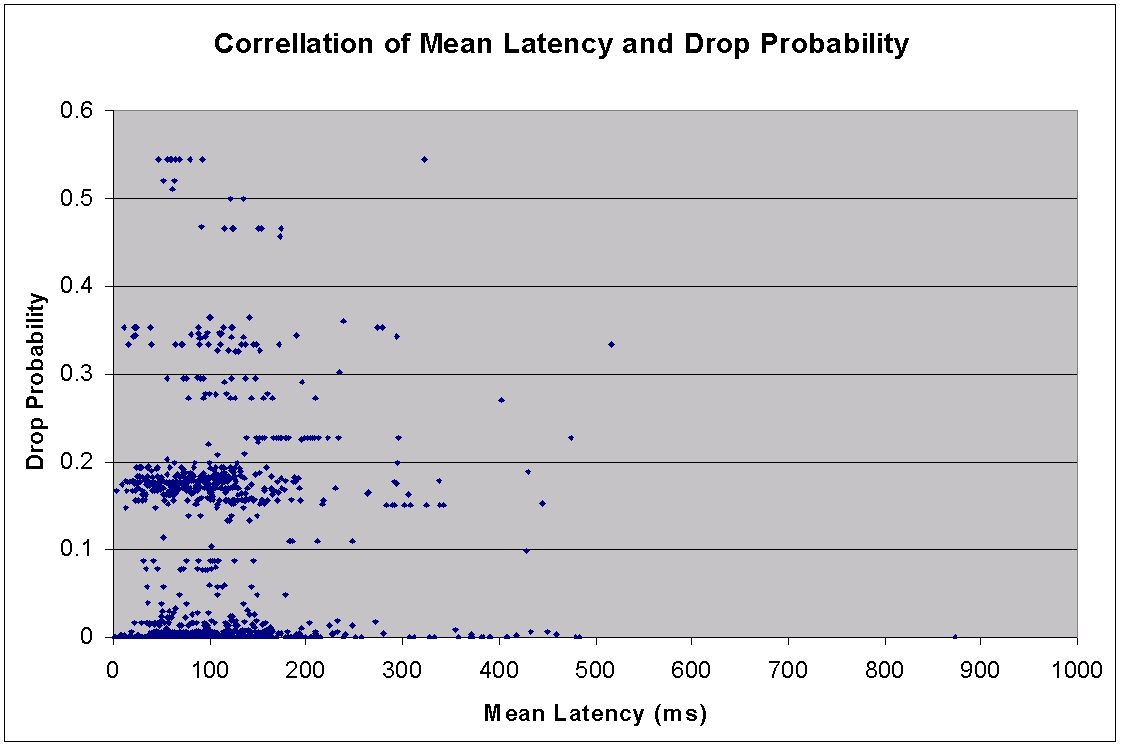
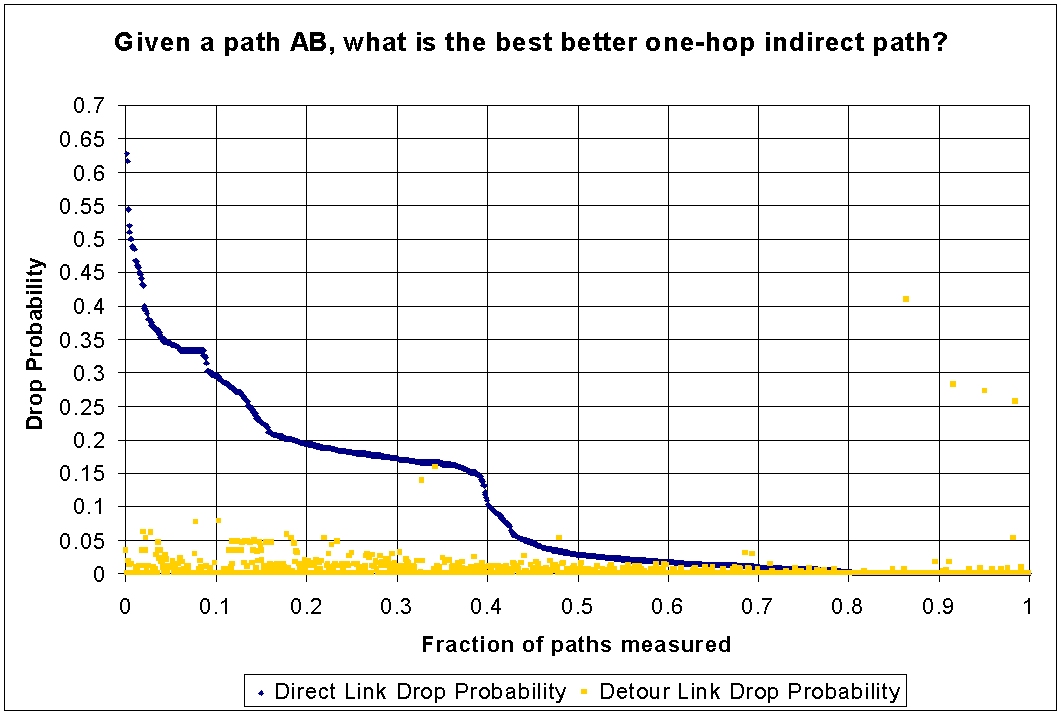
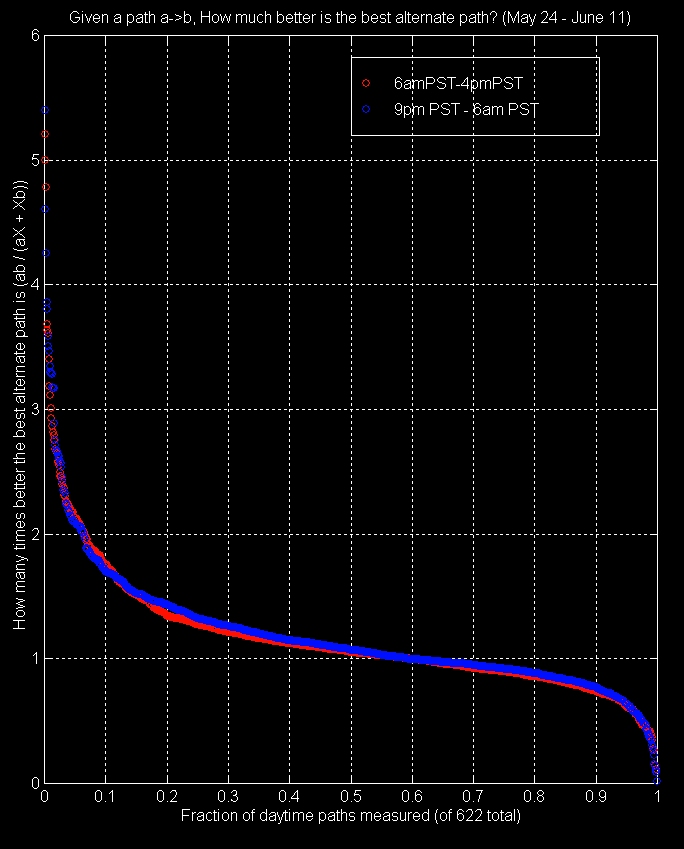
The cost metric is latency, and unless otherwise stated, the graphed values are the averages of the path round-trip latency over some time period (often all time), where the path AB is considered to be equivalent to the path BA, due to measuring the round-trip values.
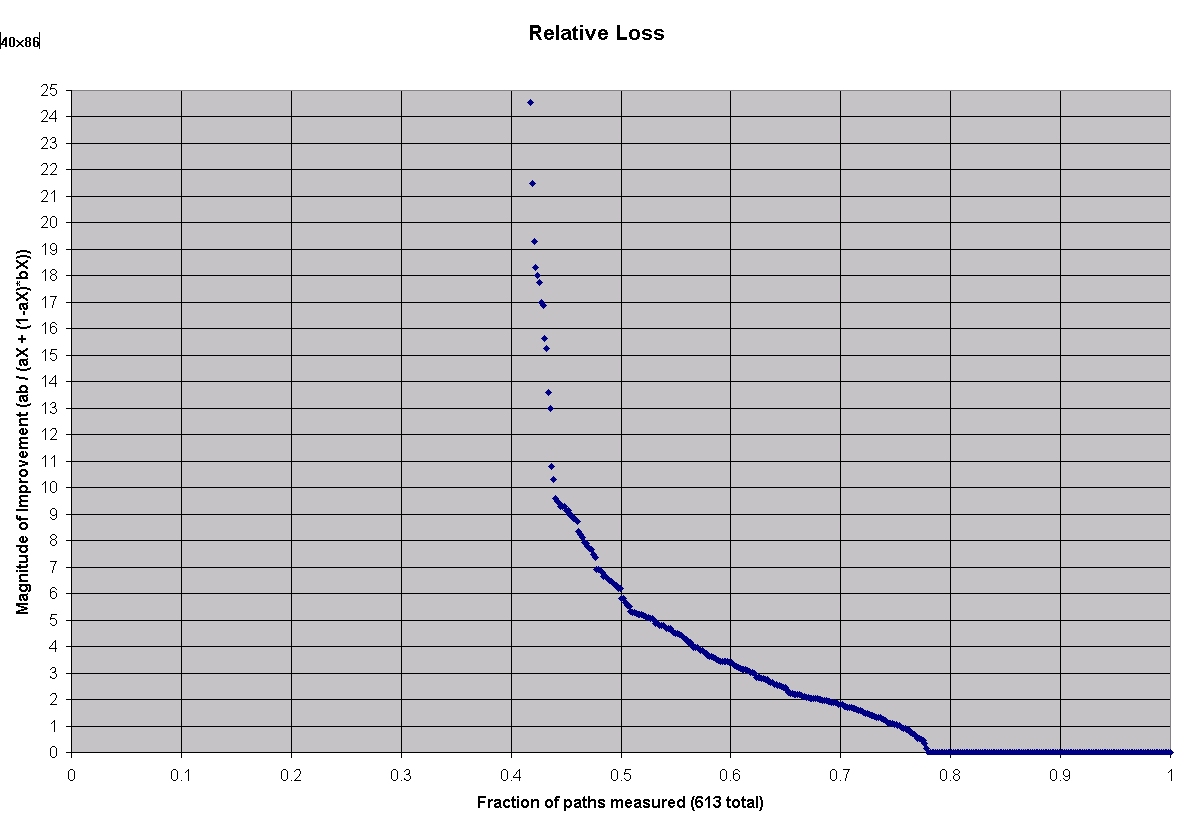
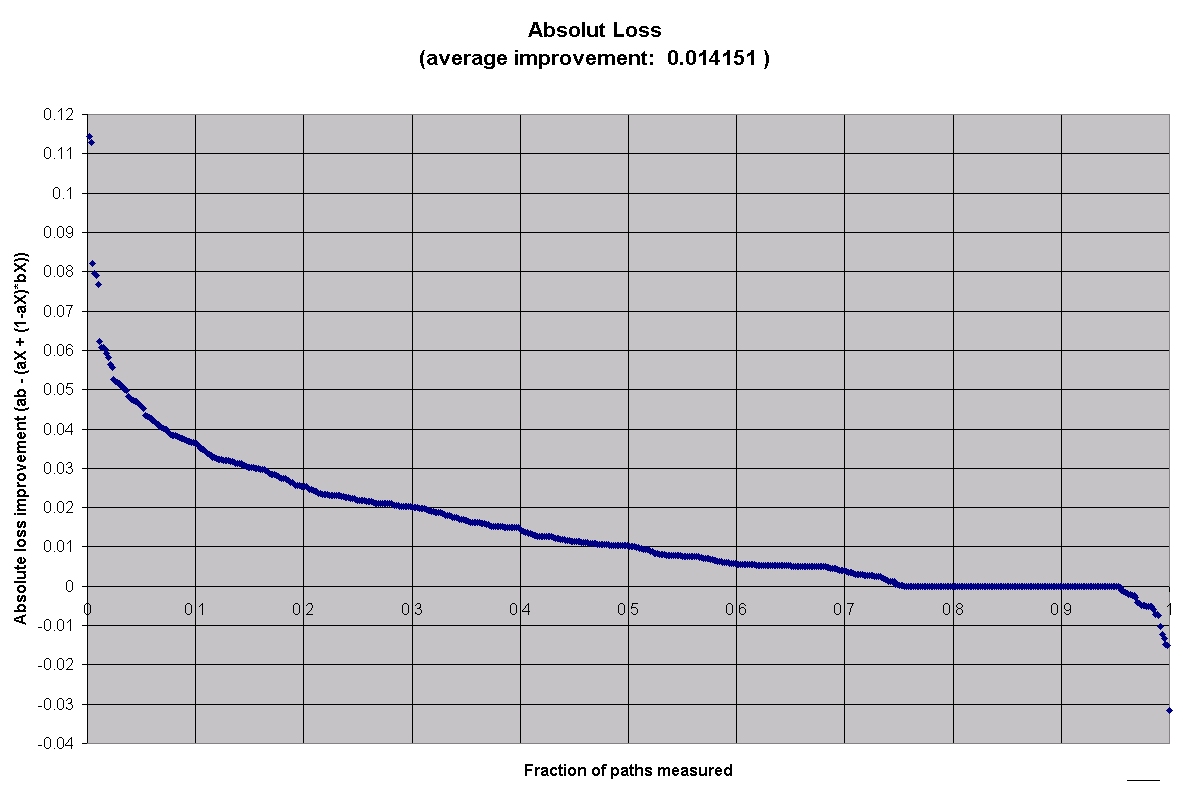
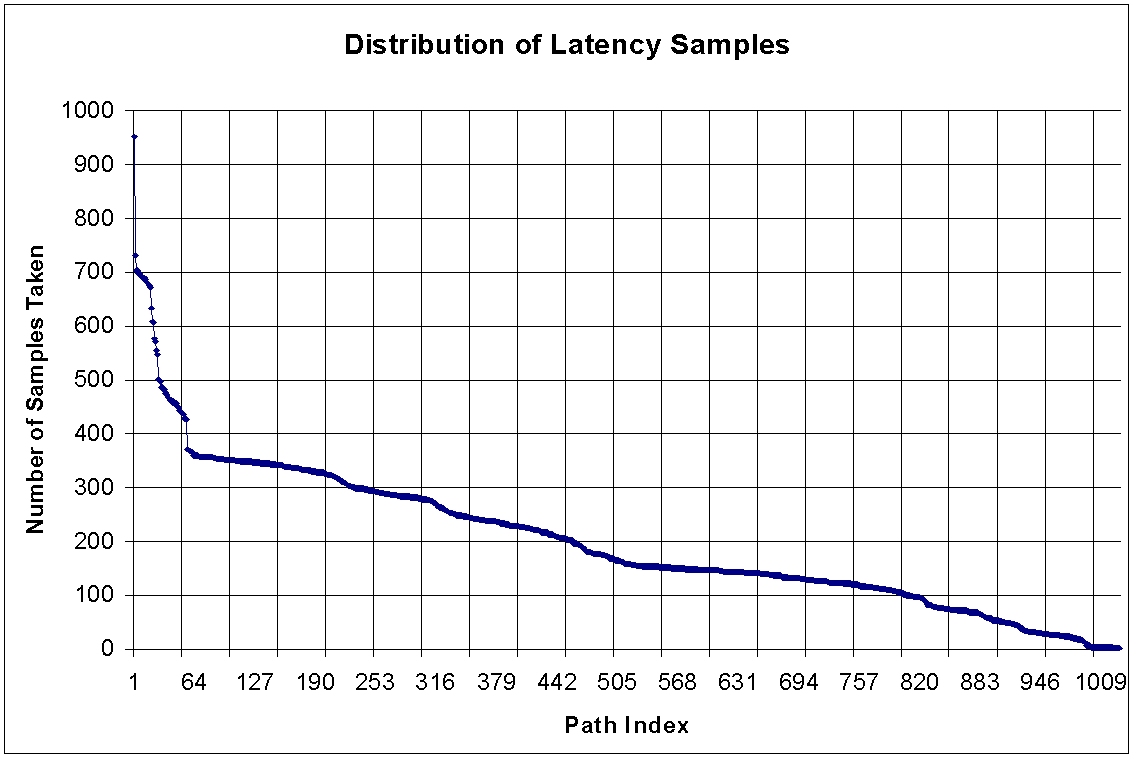
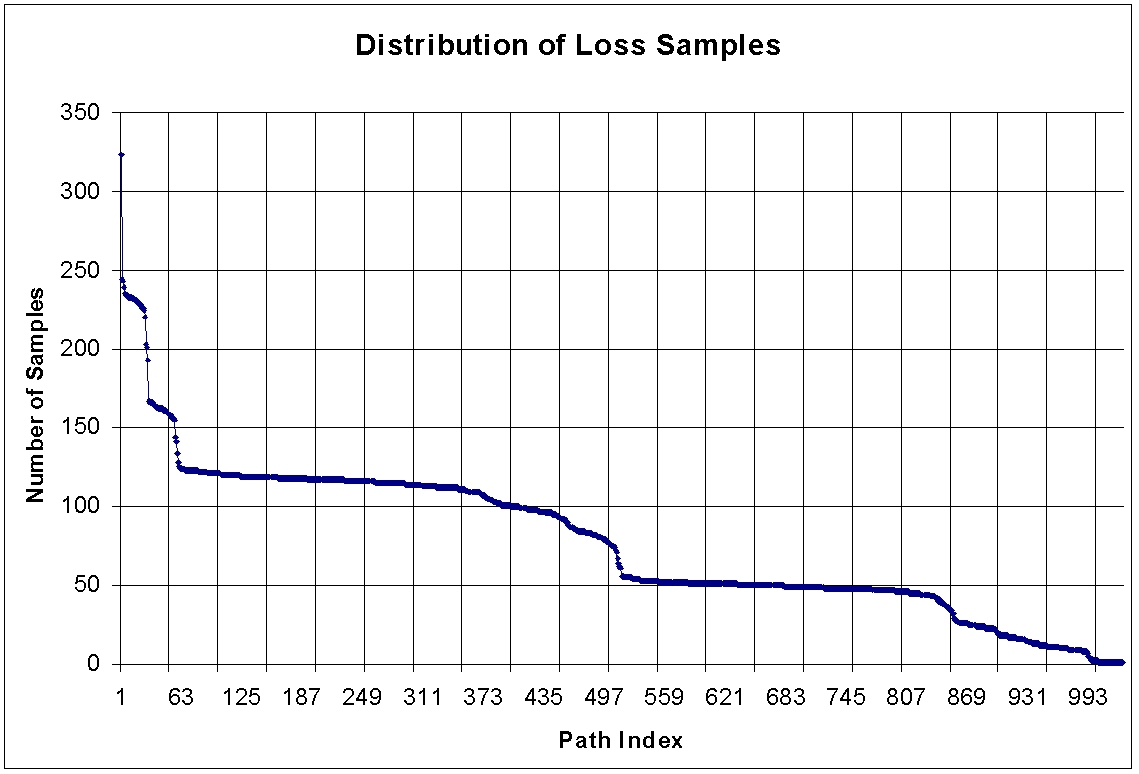
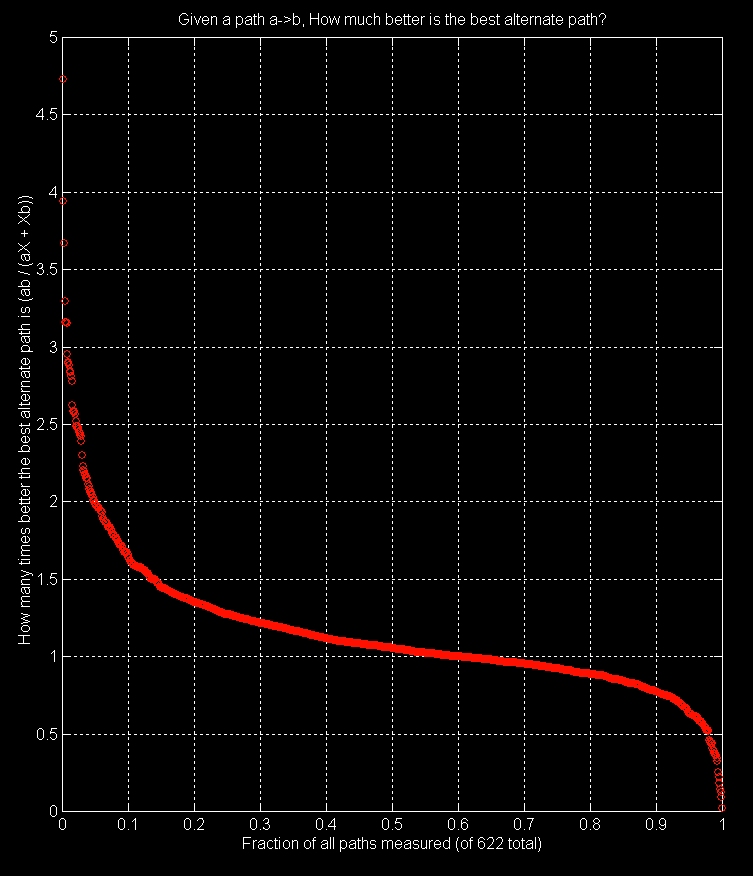
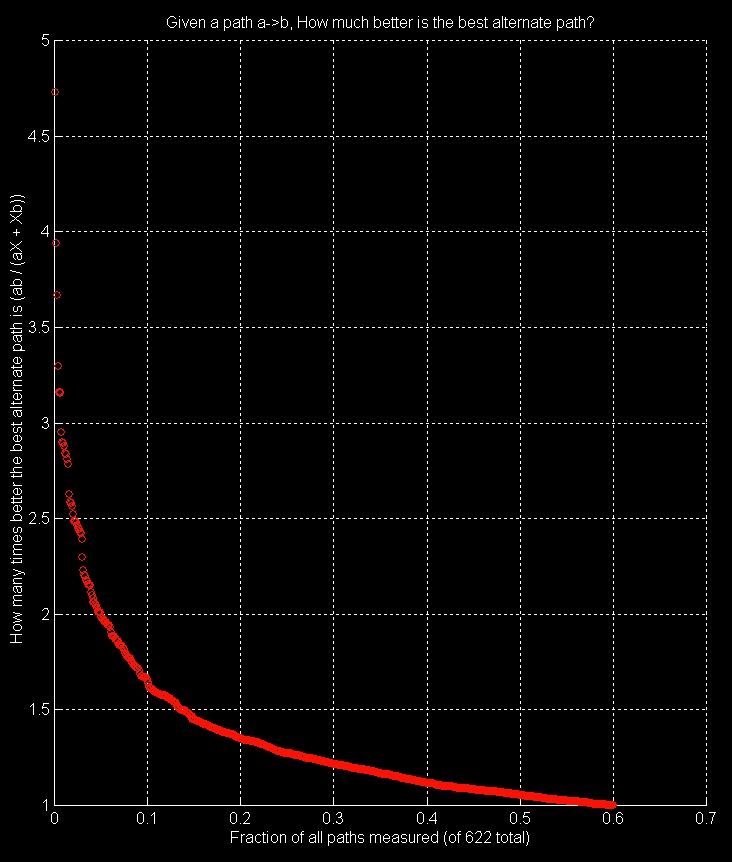
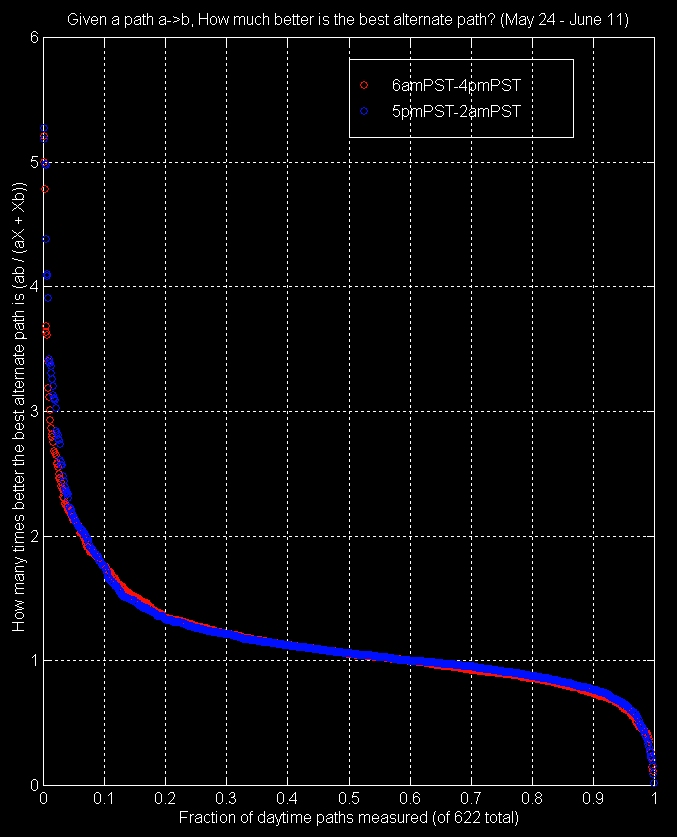
Small error: The number 622 (of total paths measured) should be around 900 to 1100, in the graphs below.
Further note: Data files are in CSV format, suitable for most applications.
WRT the code, the initial parser examines the total data set via the Nexus implementation (slow), and spits out a file containing:
For the archivistically curious, the original measurement proposal is available from here.